Skip to content

For people who run many websites

One dashboard for every website you own.

Connect Google Search Console and see what's growing, what's declining, and what deserves your attention.

  • Read-only Search Console access
  • Free for up to 3 properties
  • Multiple Google accounts from Solo
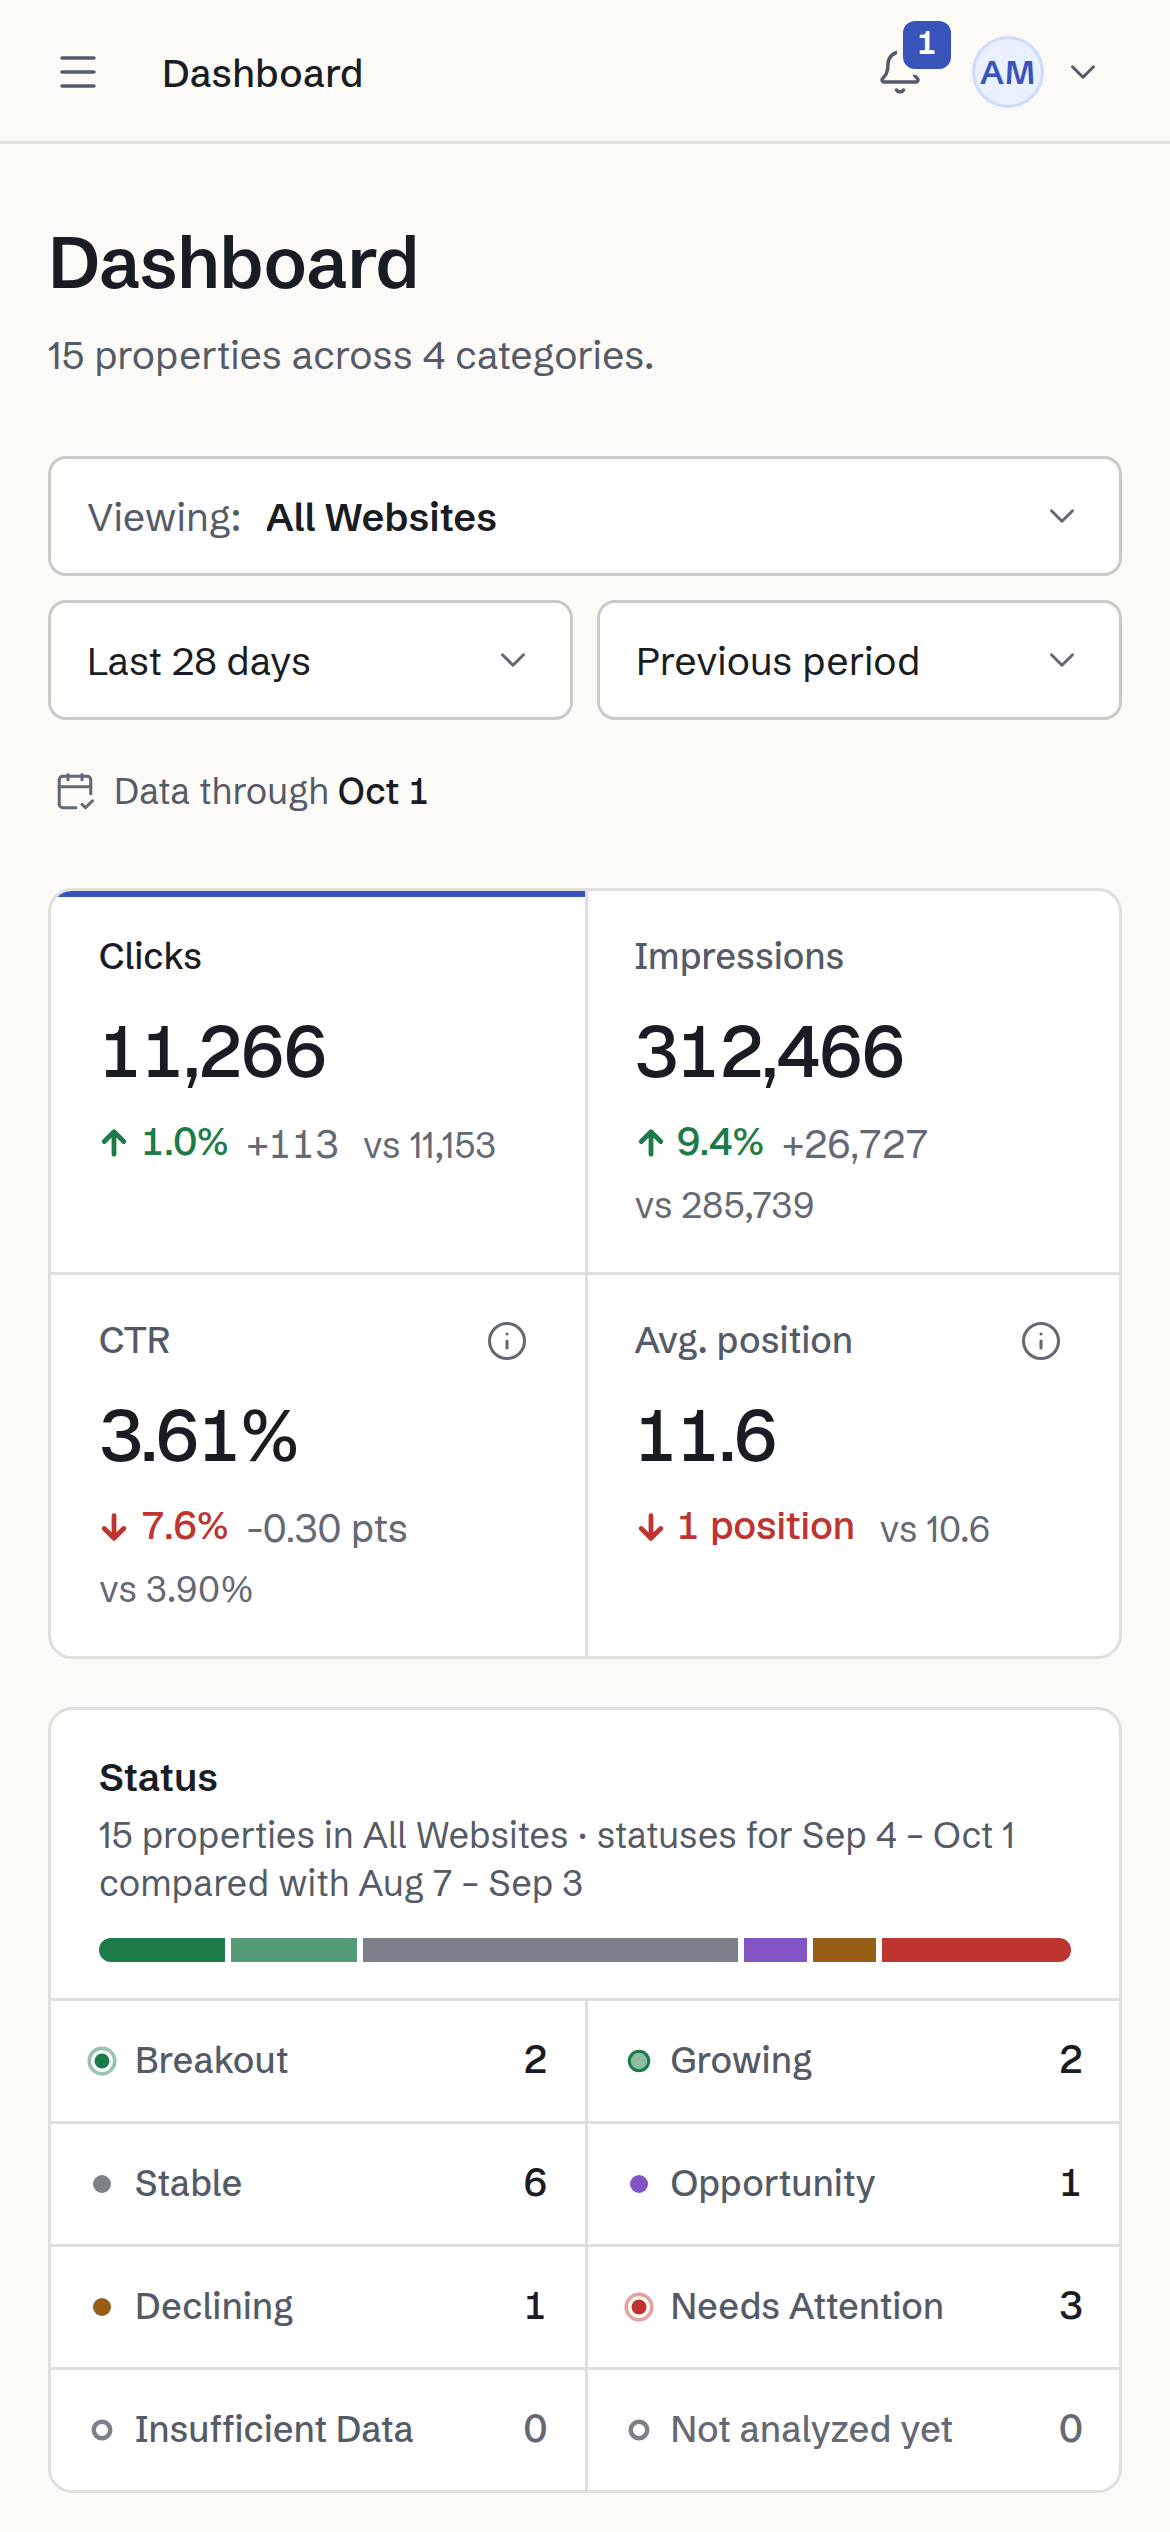
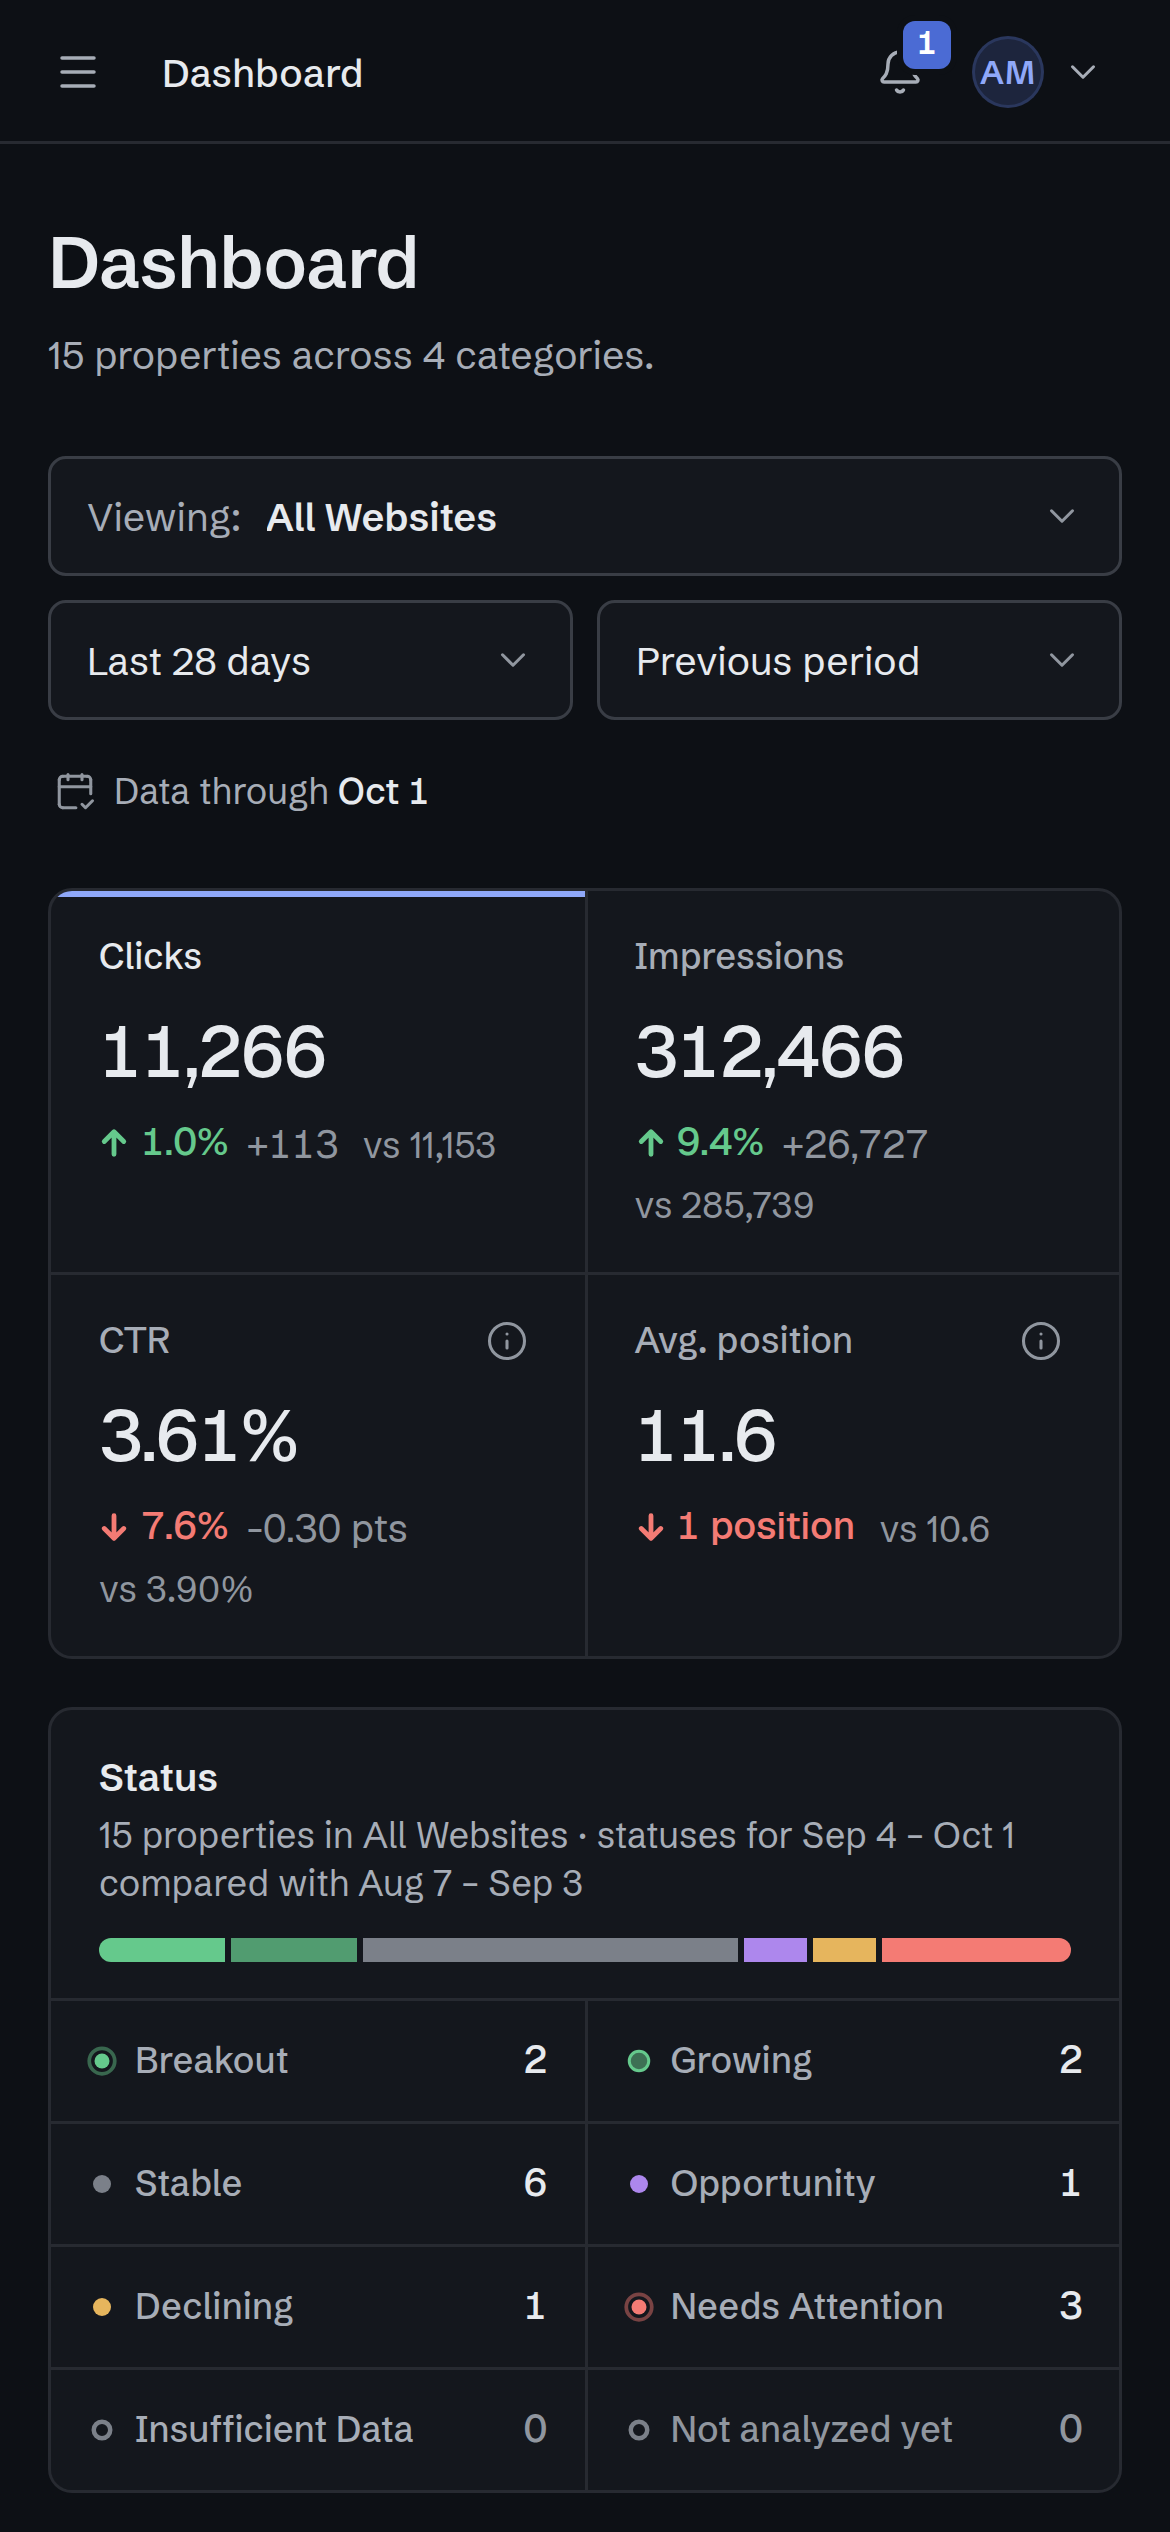
The dashboard on a phone, viewing All Websites: 11,266 clicks, 312,466 impressions, 3.61% CTR and an average position of 11.6 for the last 28 days, and websites by status. Data through Oct 1.
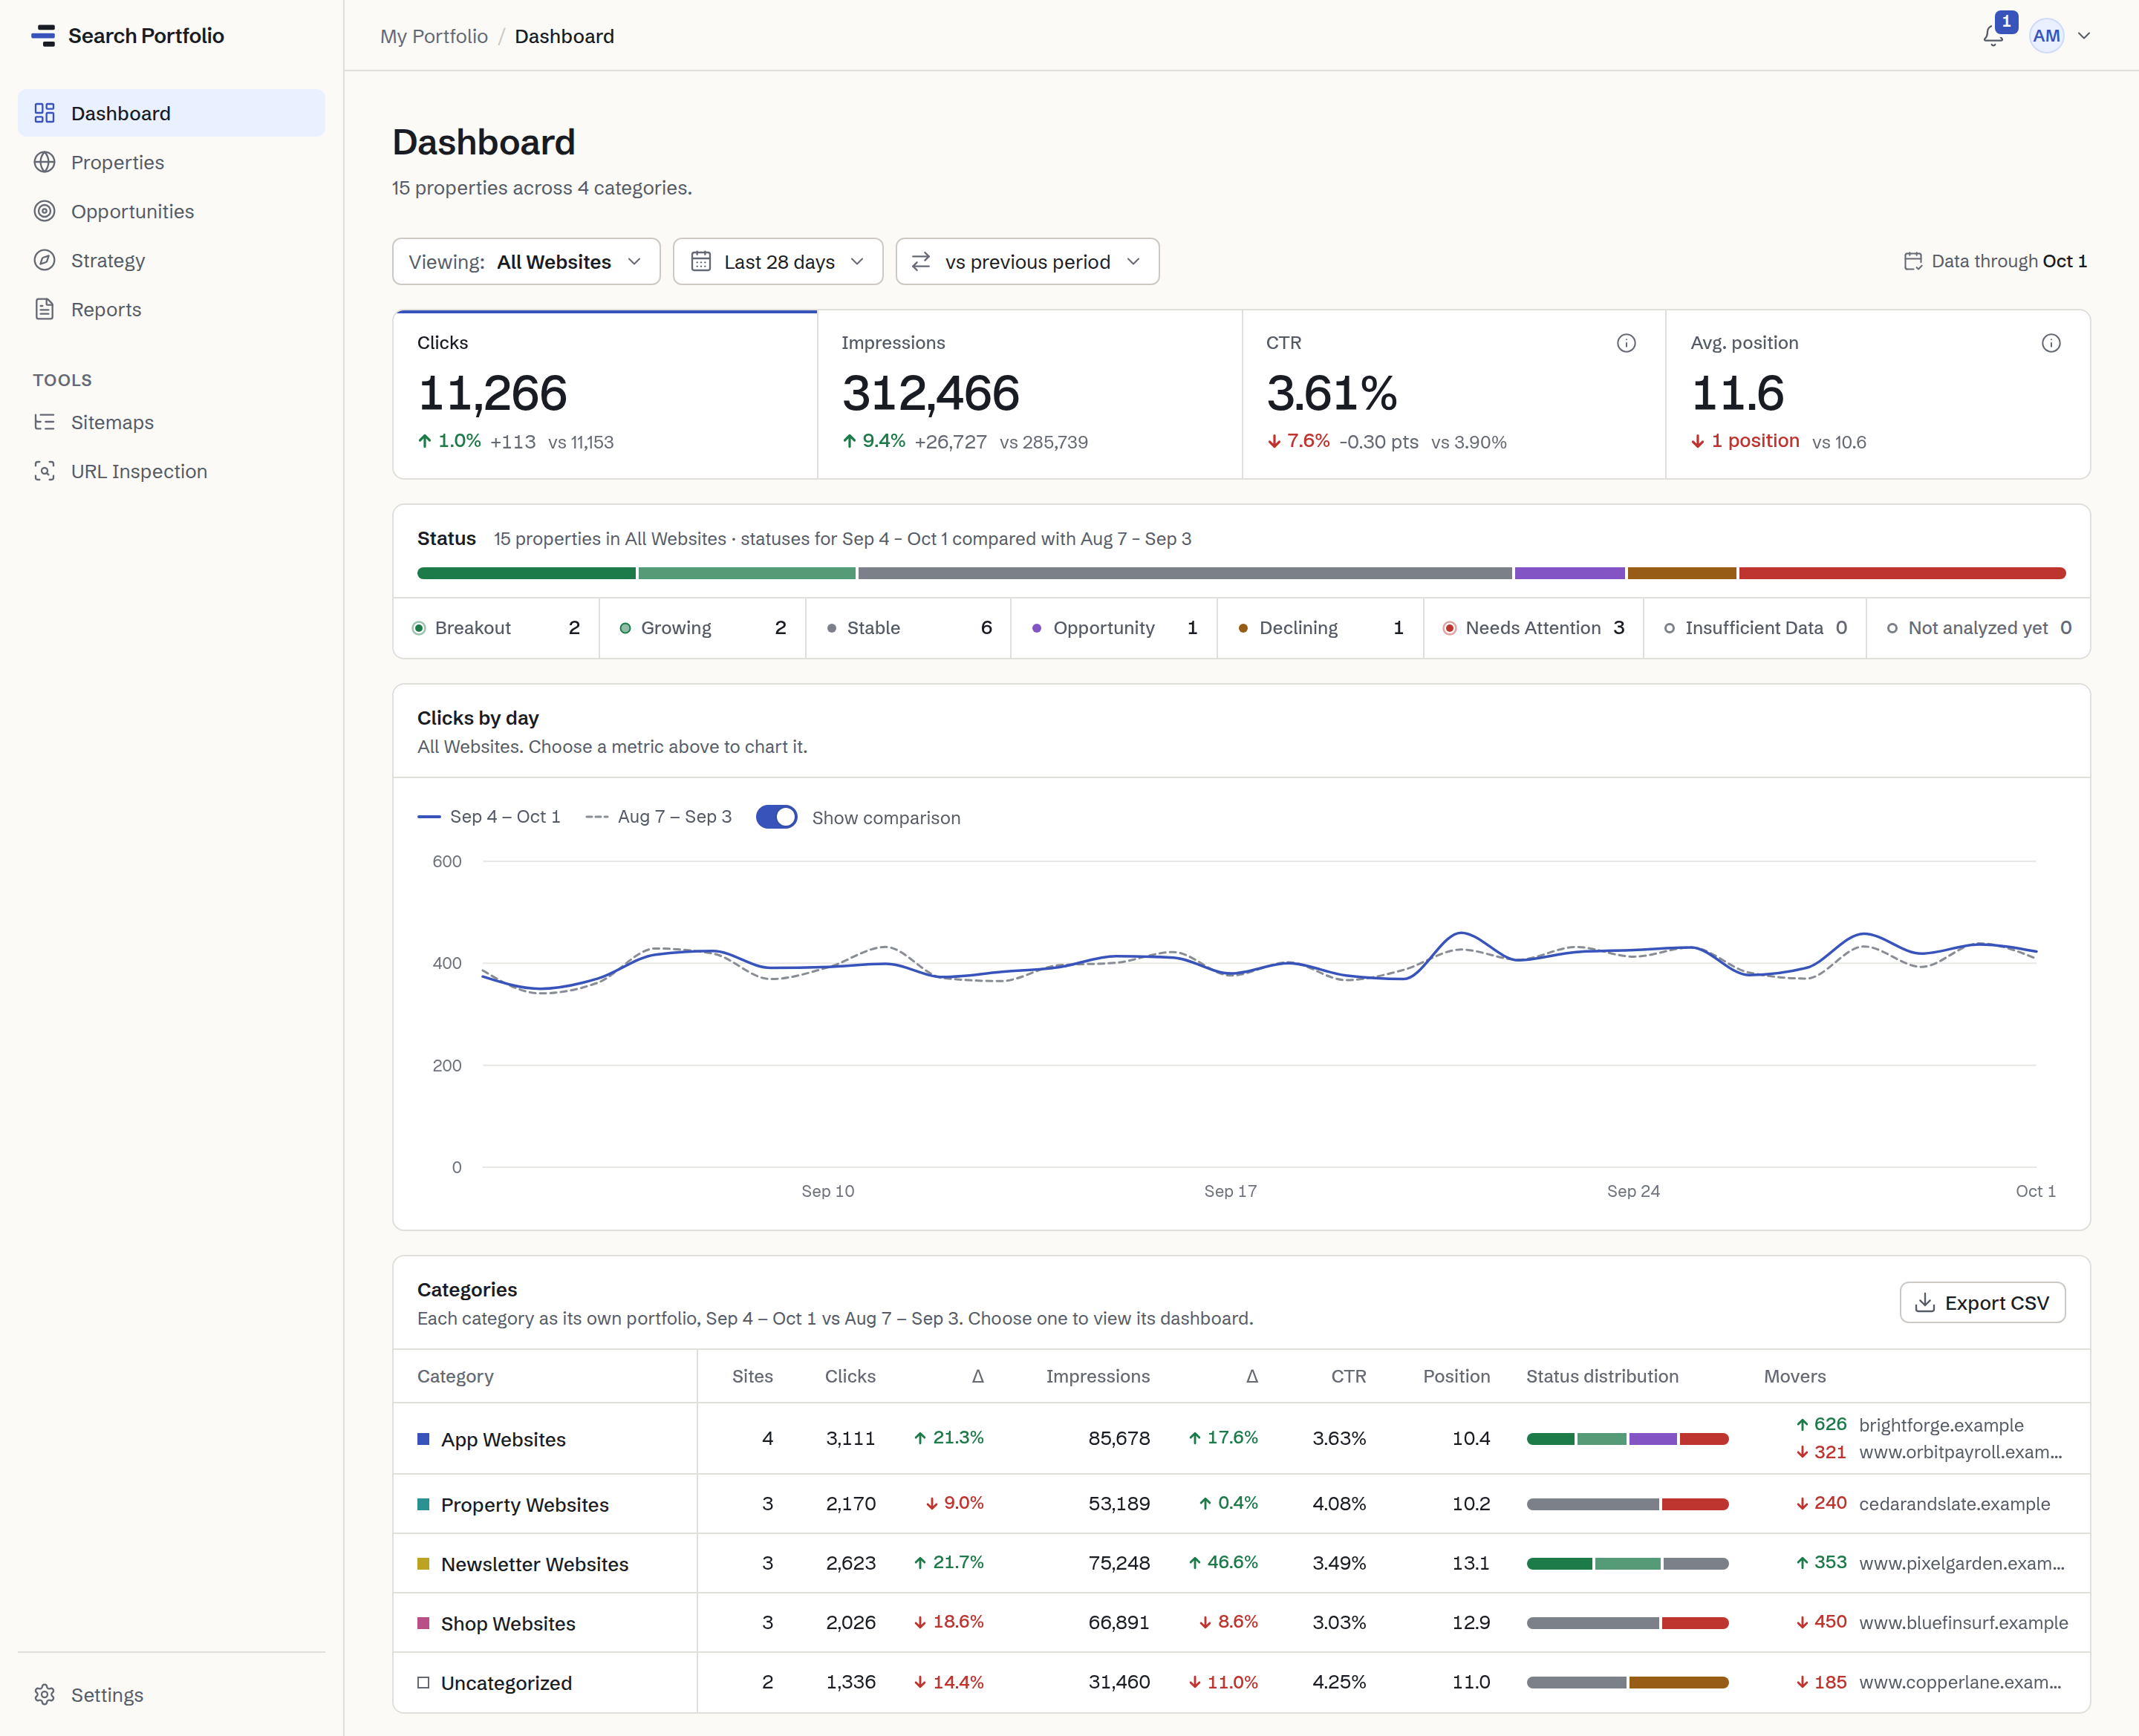
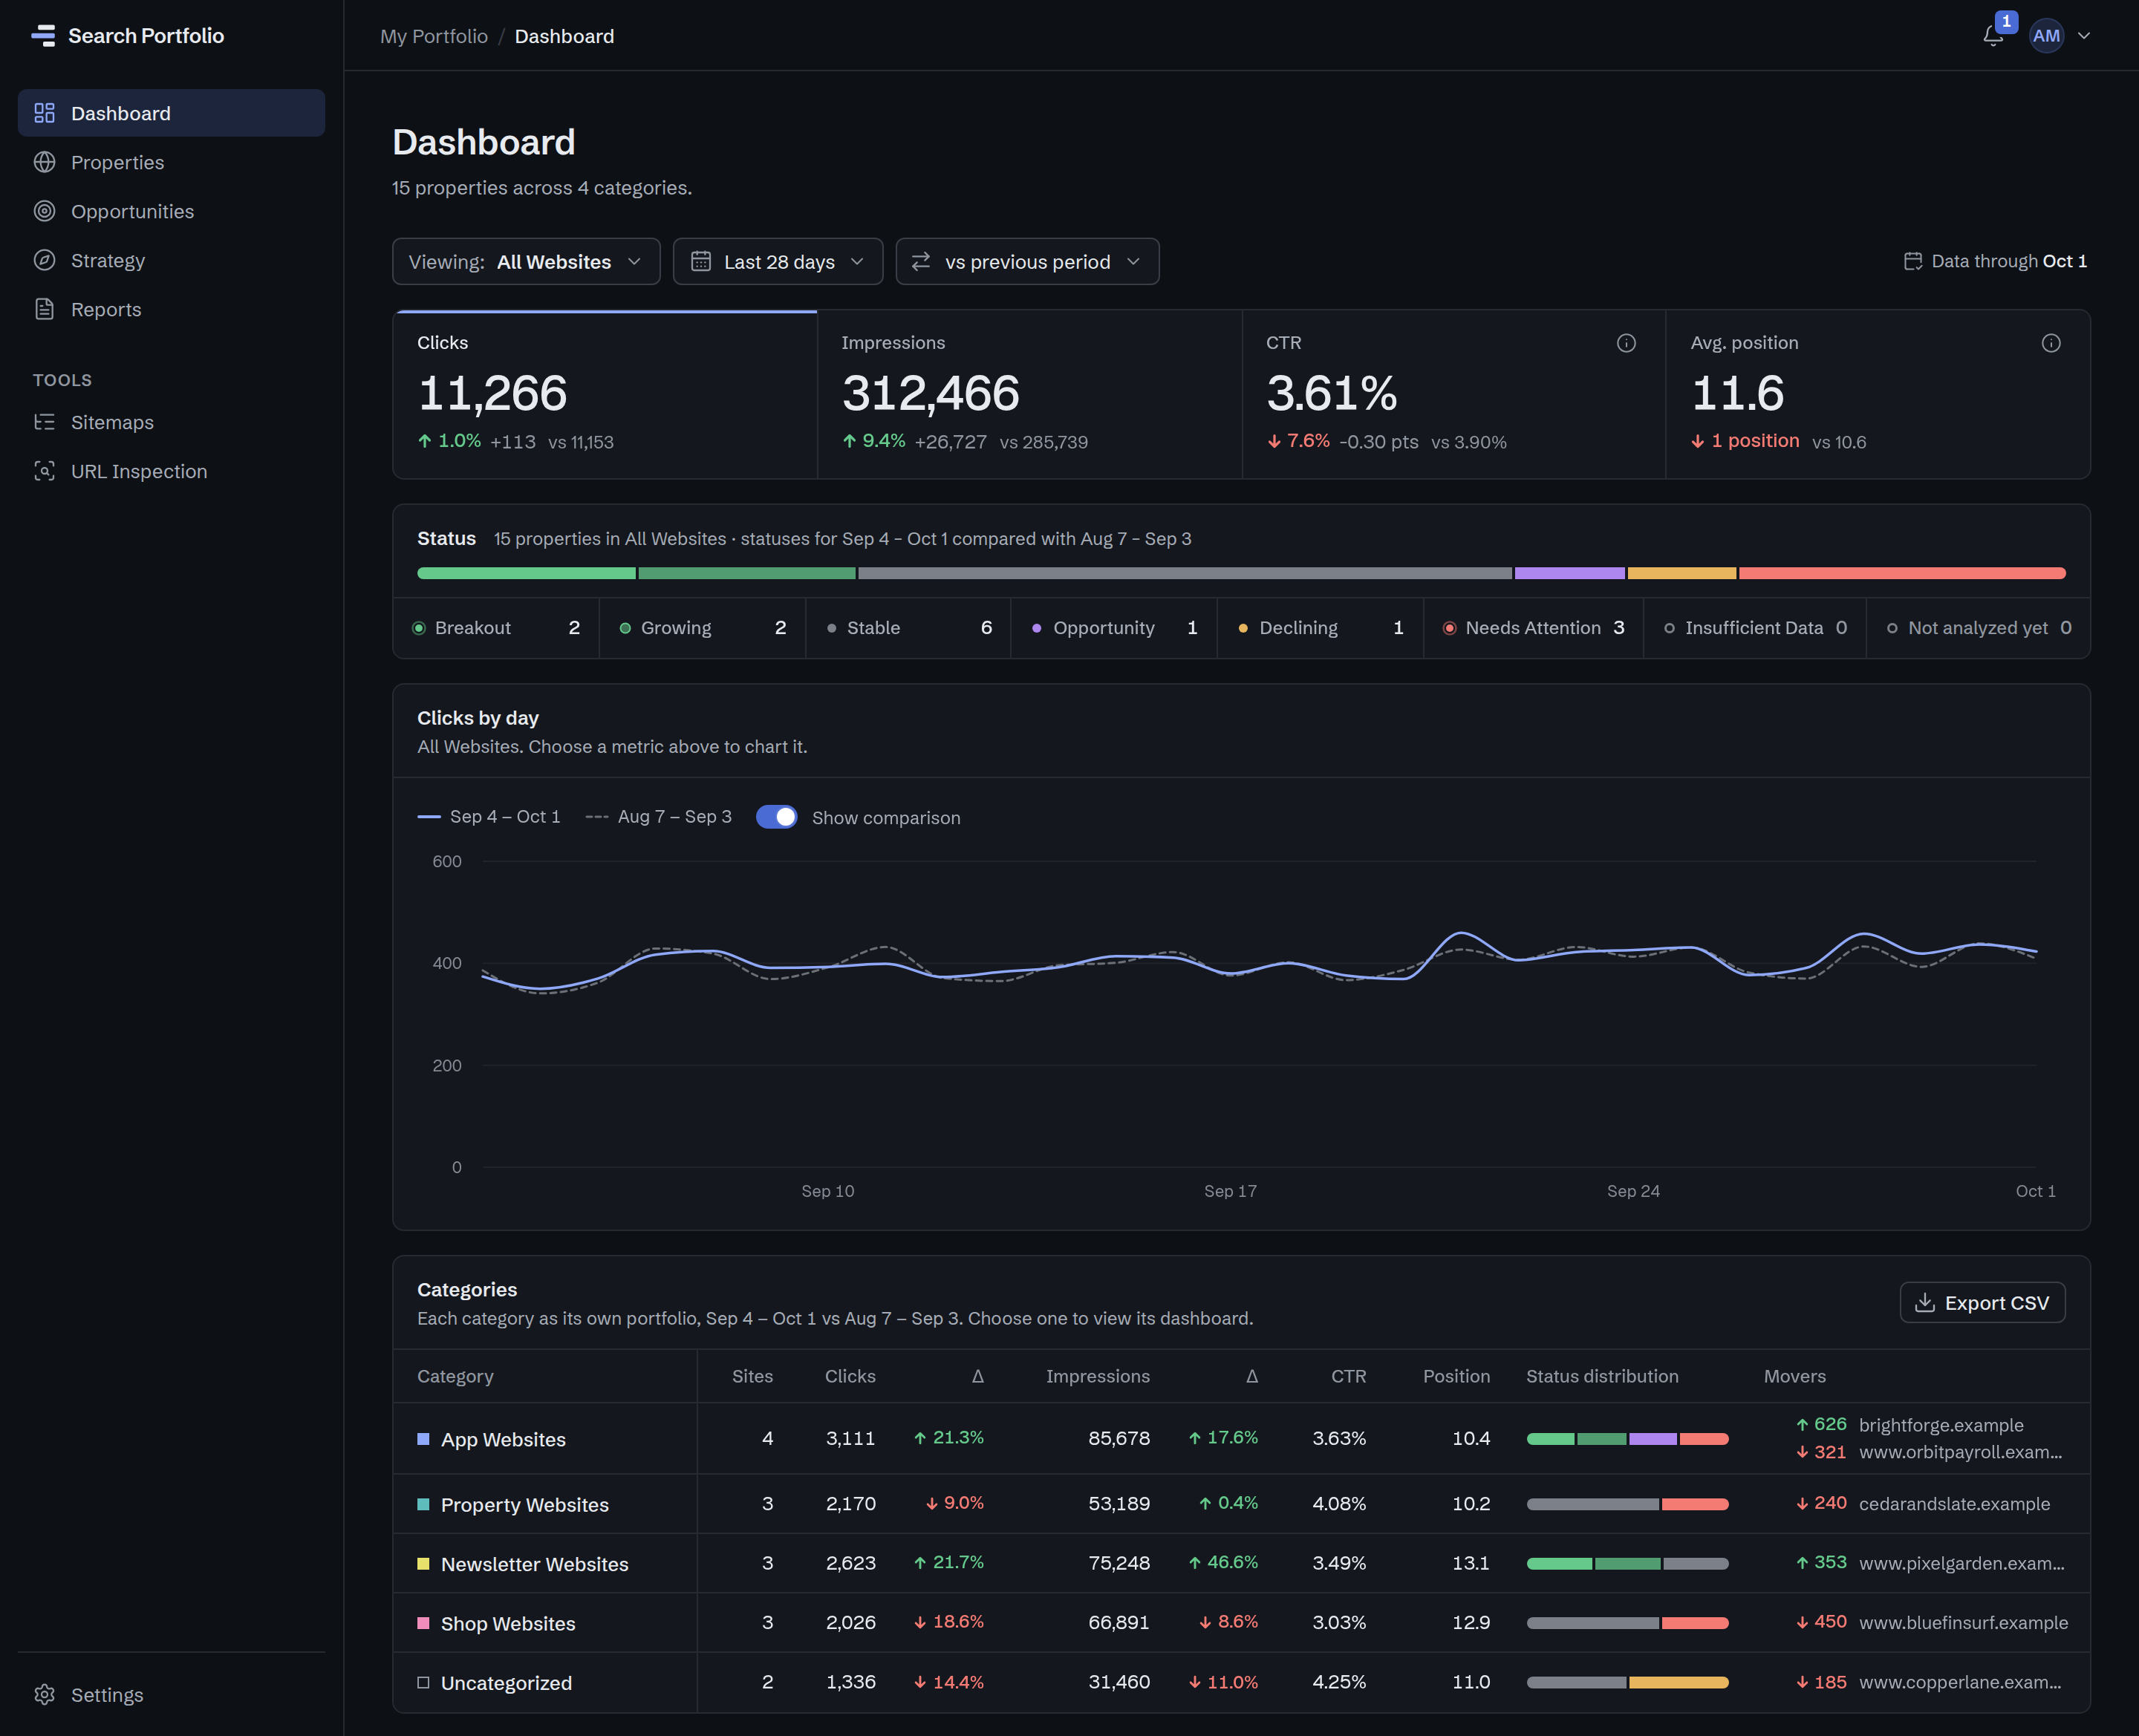
The Search Portfolio dashboard for All Websites, 15 properties across 4 categories: 11,266 clicks, 312,466 impressions, 3.61% CTR and an average position of 11.6 in the last 28 days against the previous 28, websites by status, clicks by day, and a table comparing each category. Data through Oct 1.
Dashboard · All WebsitesProduct screenshot · example data

How it works

From scattered properties to one clear view in three steps.

  1. Connect Google Search Console

    Create an account, then connect your Google account with read-only access (Solo and up connect several). Nothing in Search Console is ever changed.

  2. Choose sites and categories

    Select the properties to monitor and group them into categories that match how you run your portfolio. History is imported for you.

  3. See what deserves attention

    The dashboard and Opportunities highlight growth, declines and opportunities, for everything or one category at a time. From Solo, Strategy ranks what to review first and a weekly report arrives by email.

What you get

The portfolio intelligence layer on top of Google Search Console.

Search Portfolio doesn't just organize your Search Console data. It reads every property you choose, across all your Google accounts, and tells you what deserves your attention.

All Your Sites

See every selected Search Console property together.

Free connects 1 Google account; Solo and up connect 5 to 50.

Every Google account.
Connect the accounts your websites live in; their properties land in one portfolio, each counted once.
Domain and URL-prefix properties.
Side by side, with possible overlaps flagged before they double-count your totals.
Honest portfolio math.
CTR comes from total clicks and impressions, and average position is weighted by impressions.
A status for every website.
Breakout, Growing, Stable, Opportunity, Declining or Needs Attention, each with the reason behind it.
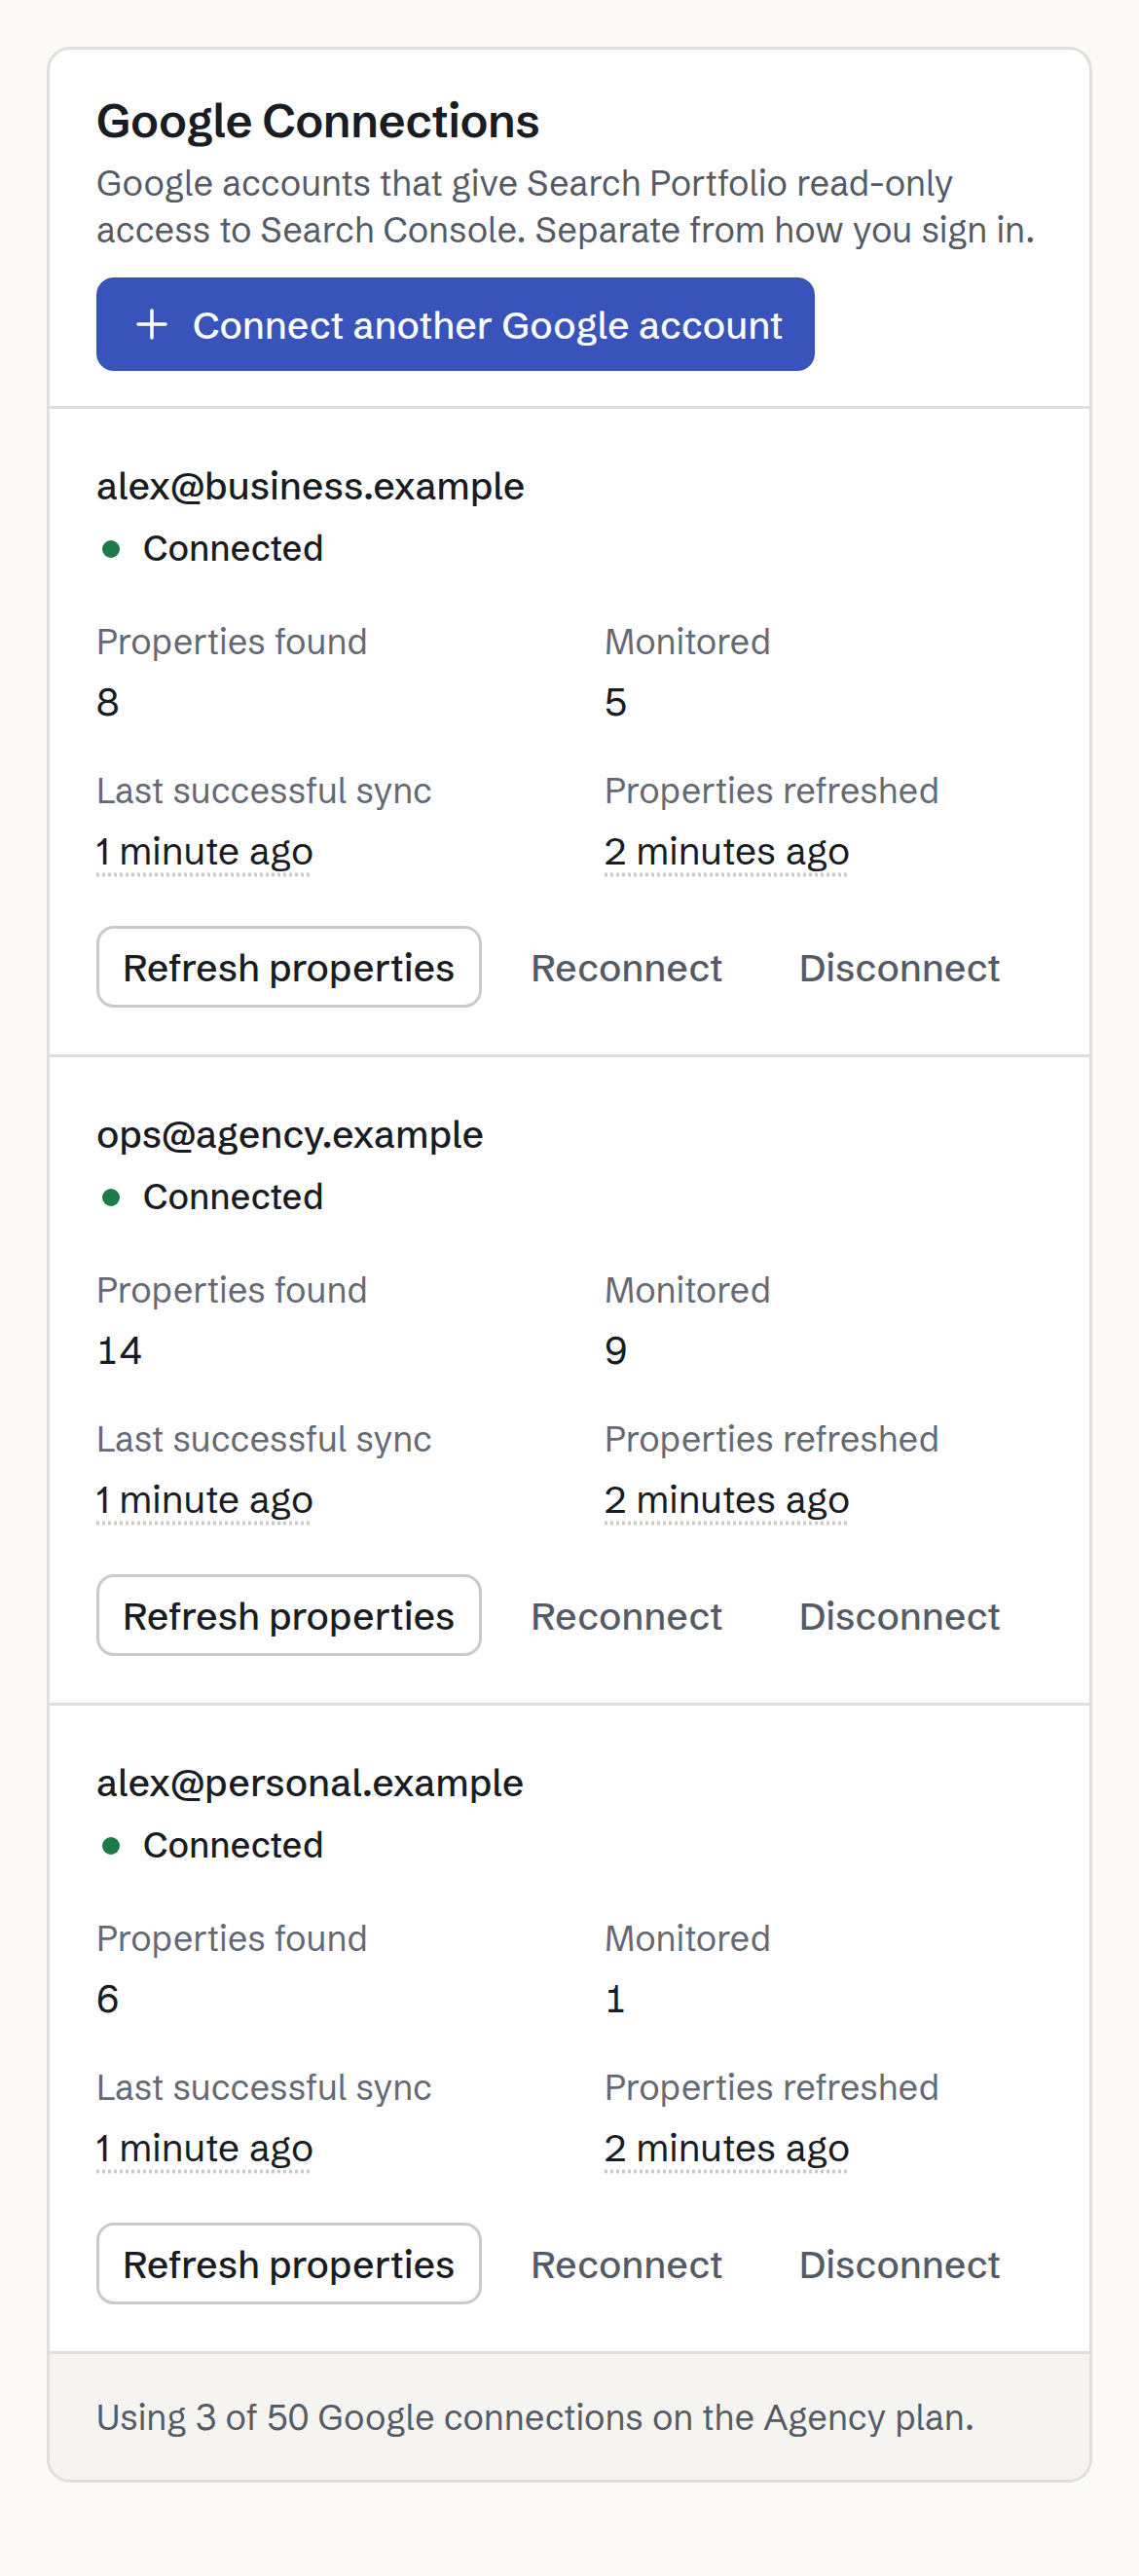
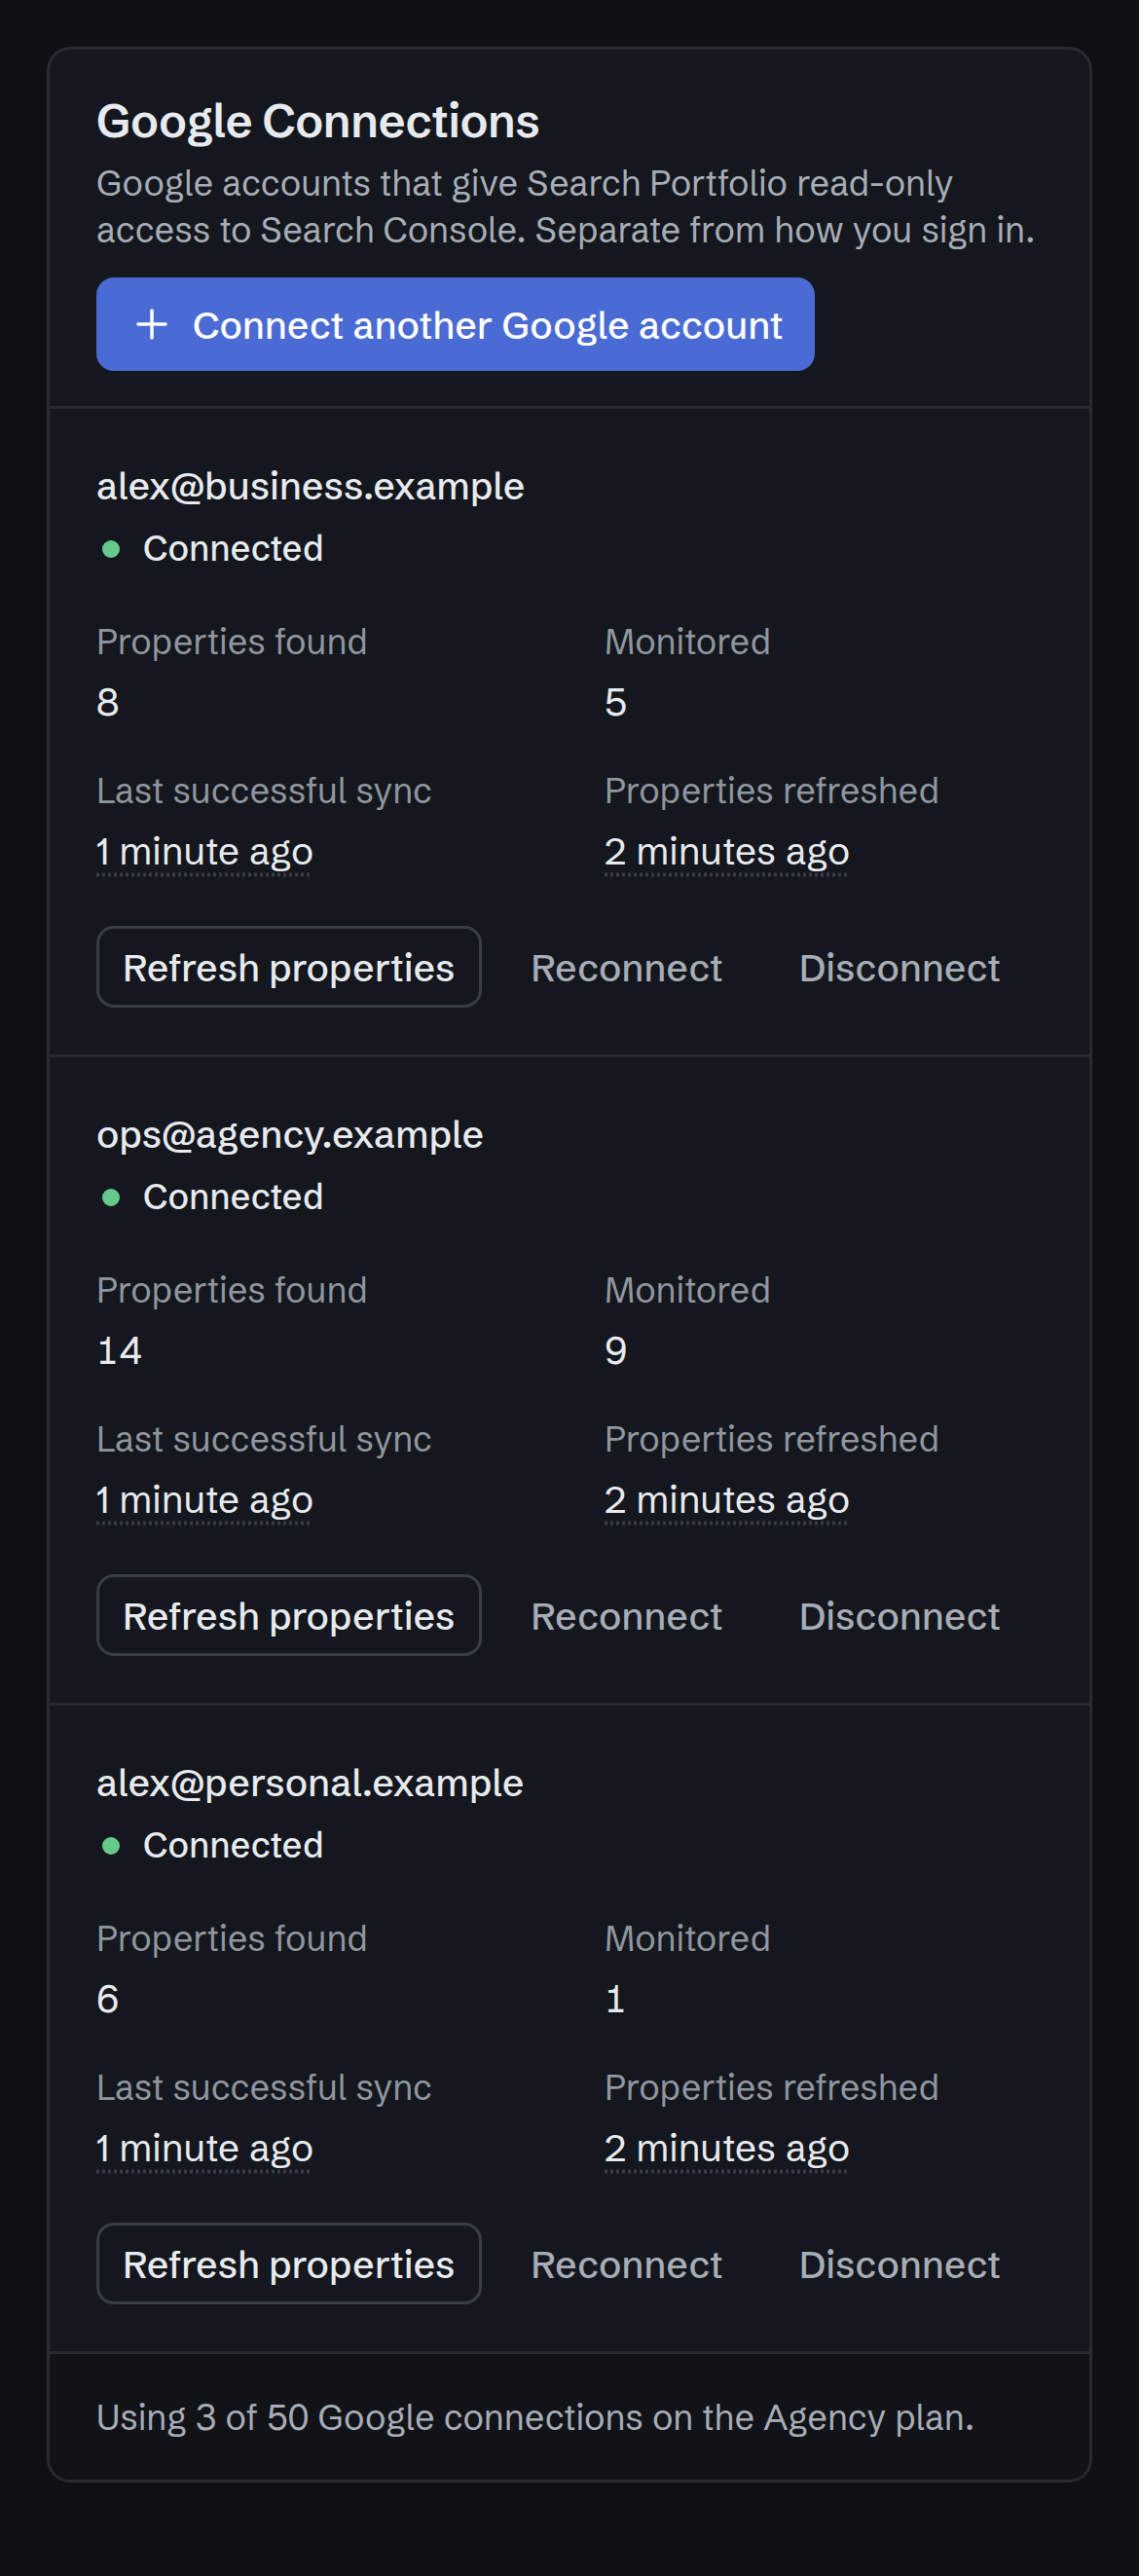
Settings → Google Connections on a phone: 3 Google accounts connected with read-only access to Search Console (alex@business.example: 8 properties found; ops@agency.example: 14 properties found; alex@personal.example: 6 properties found).
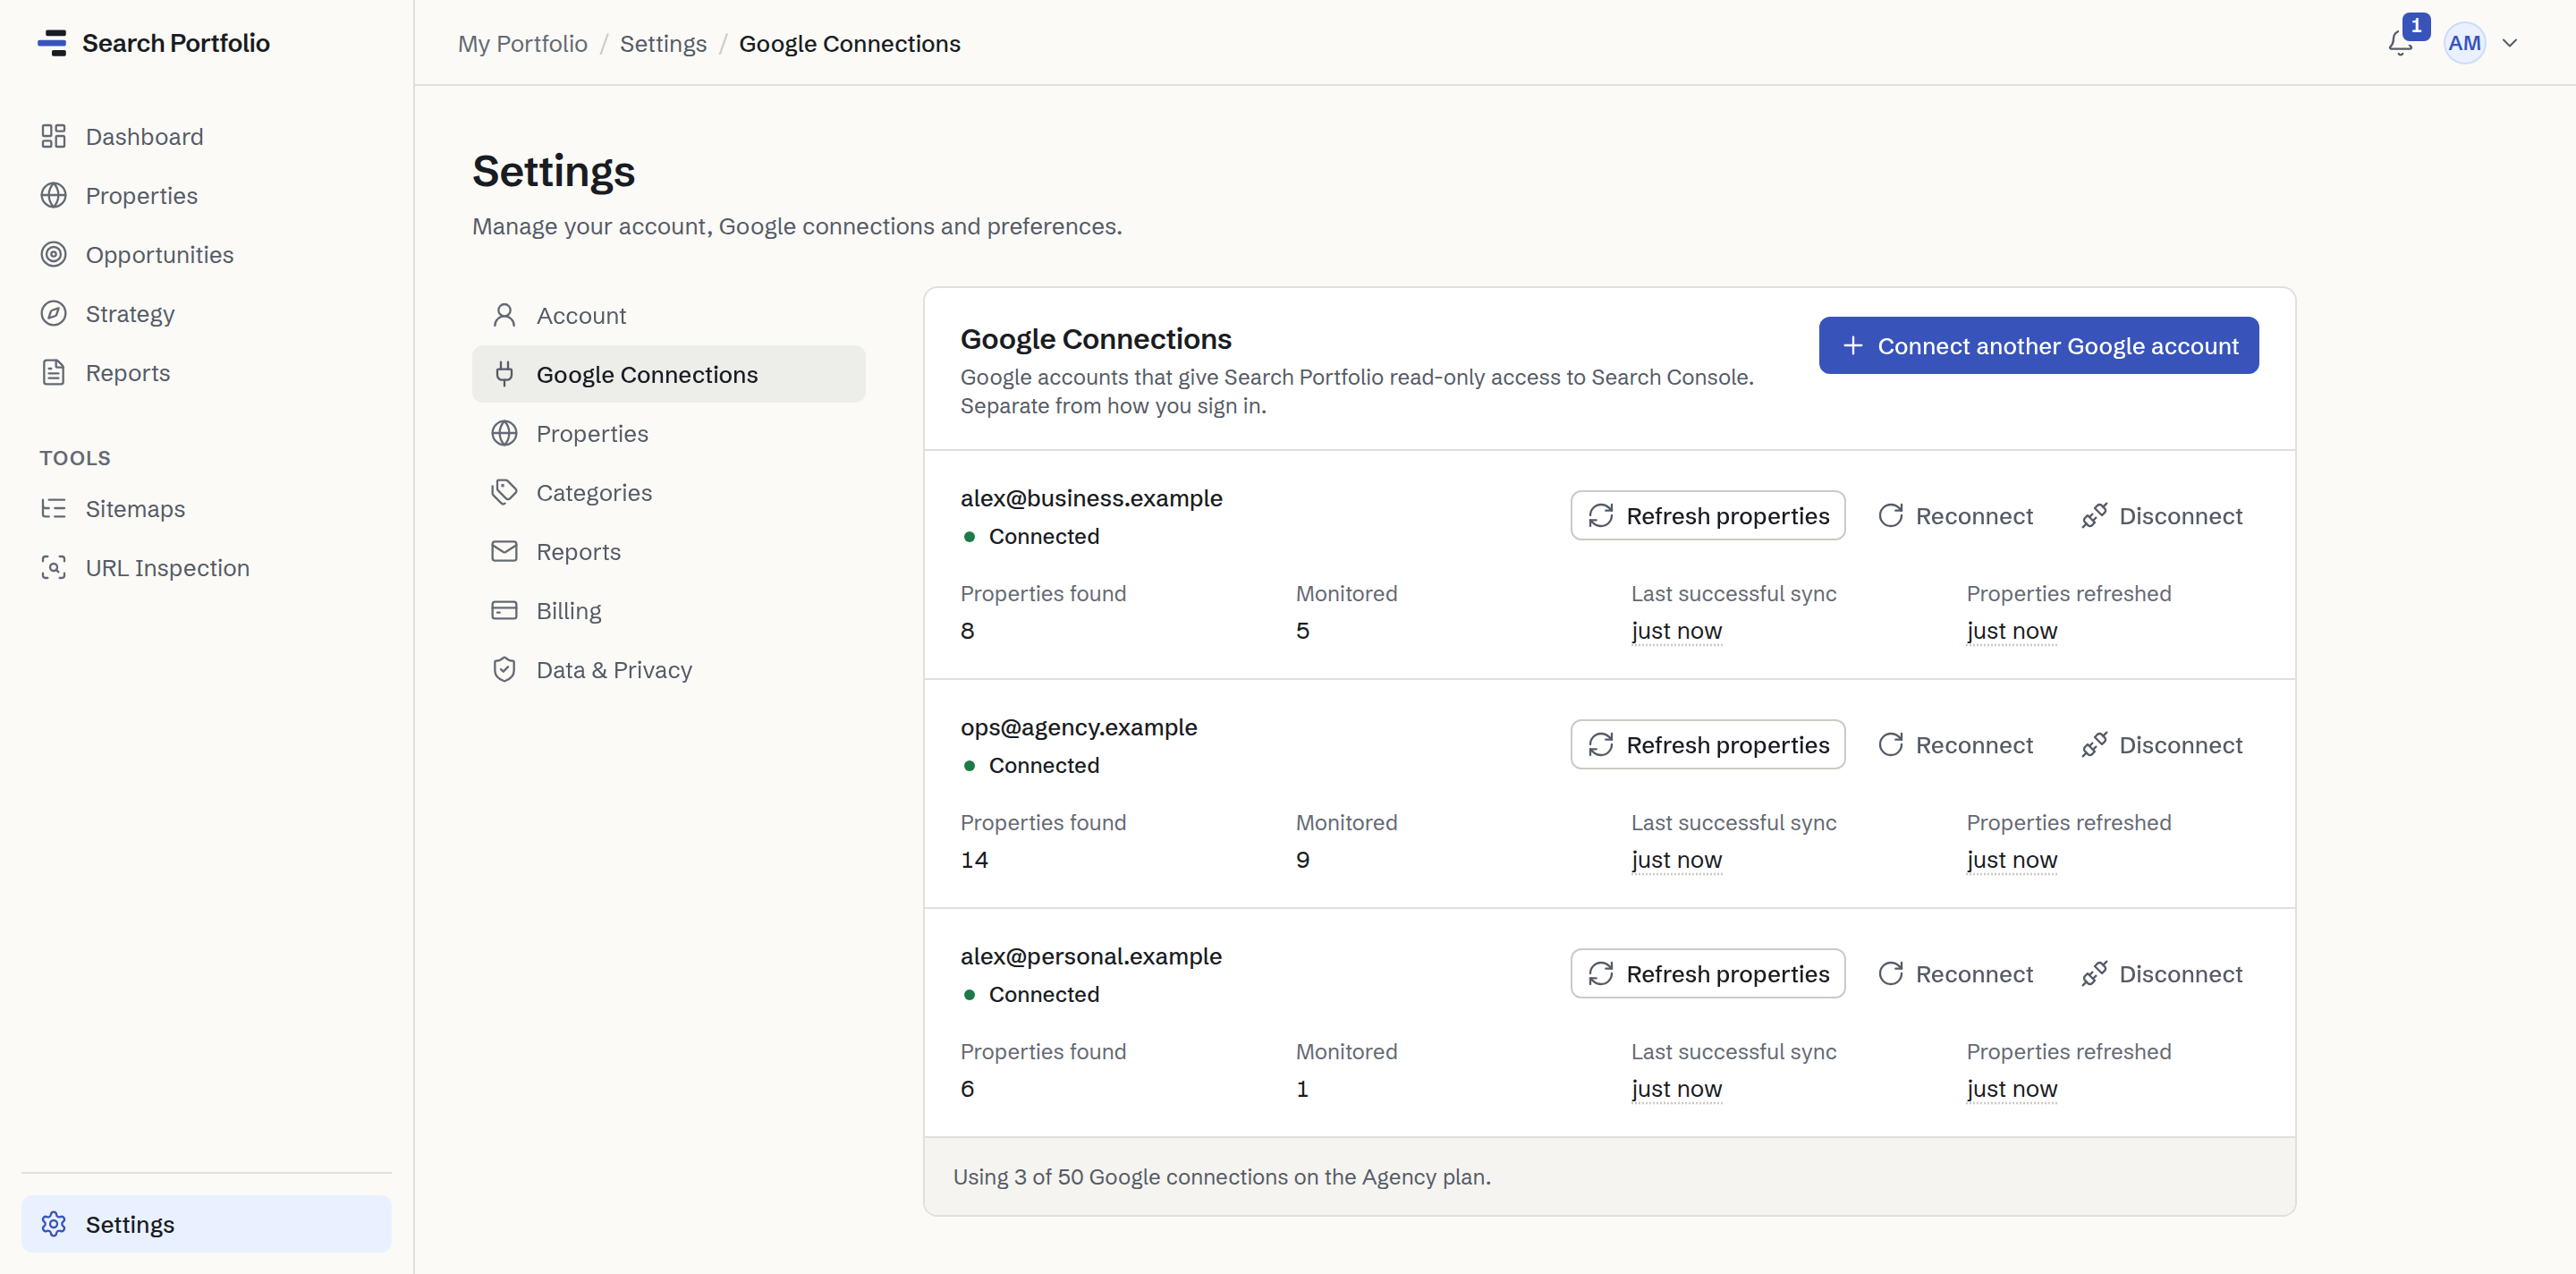
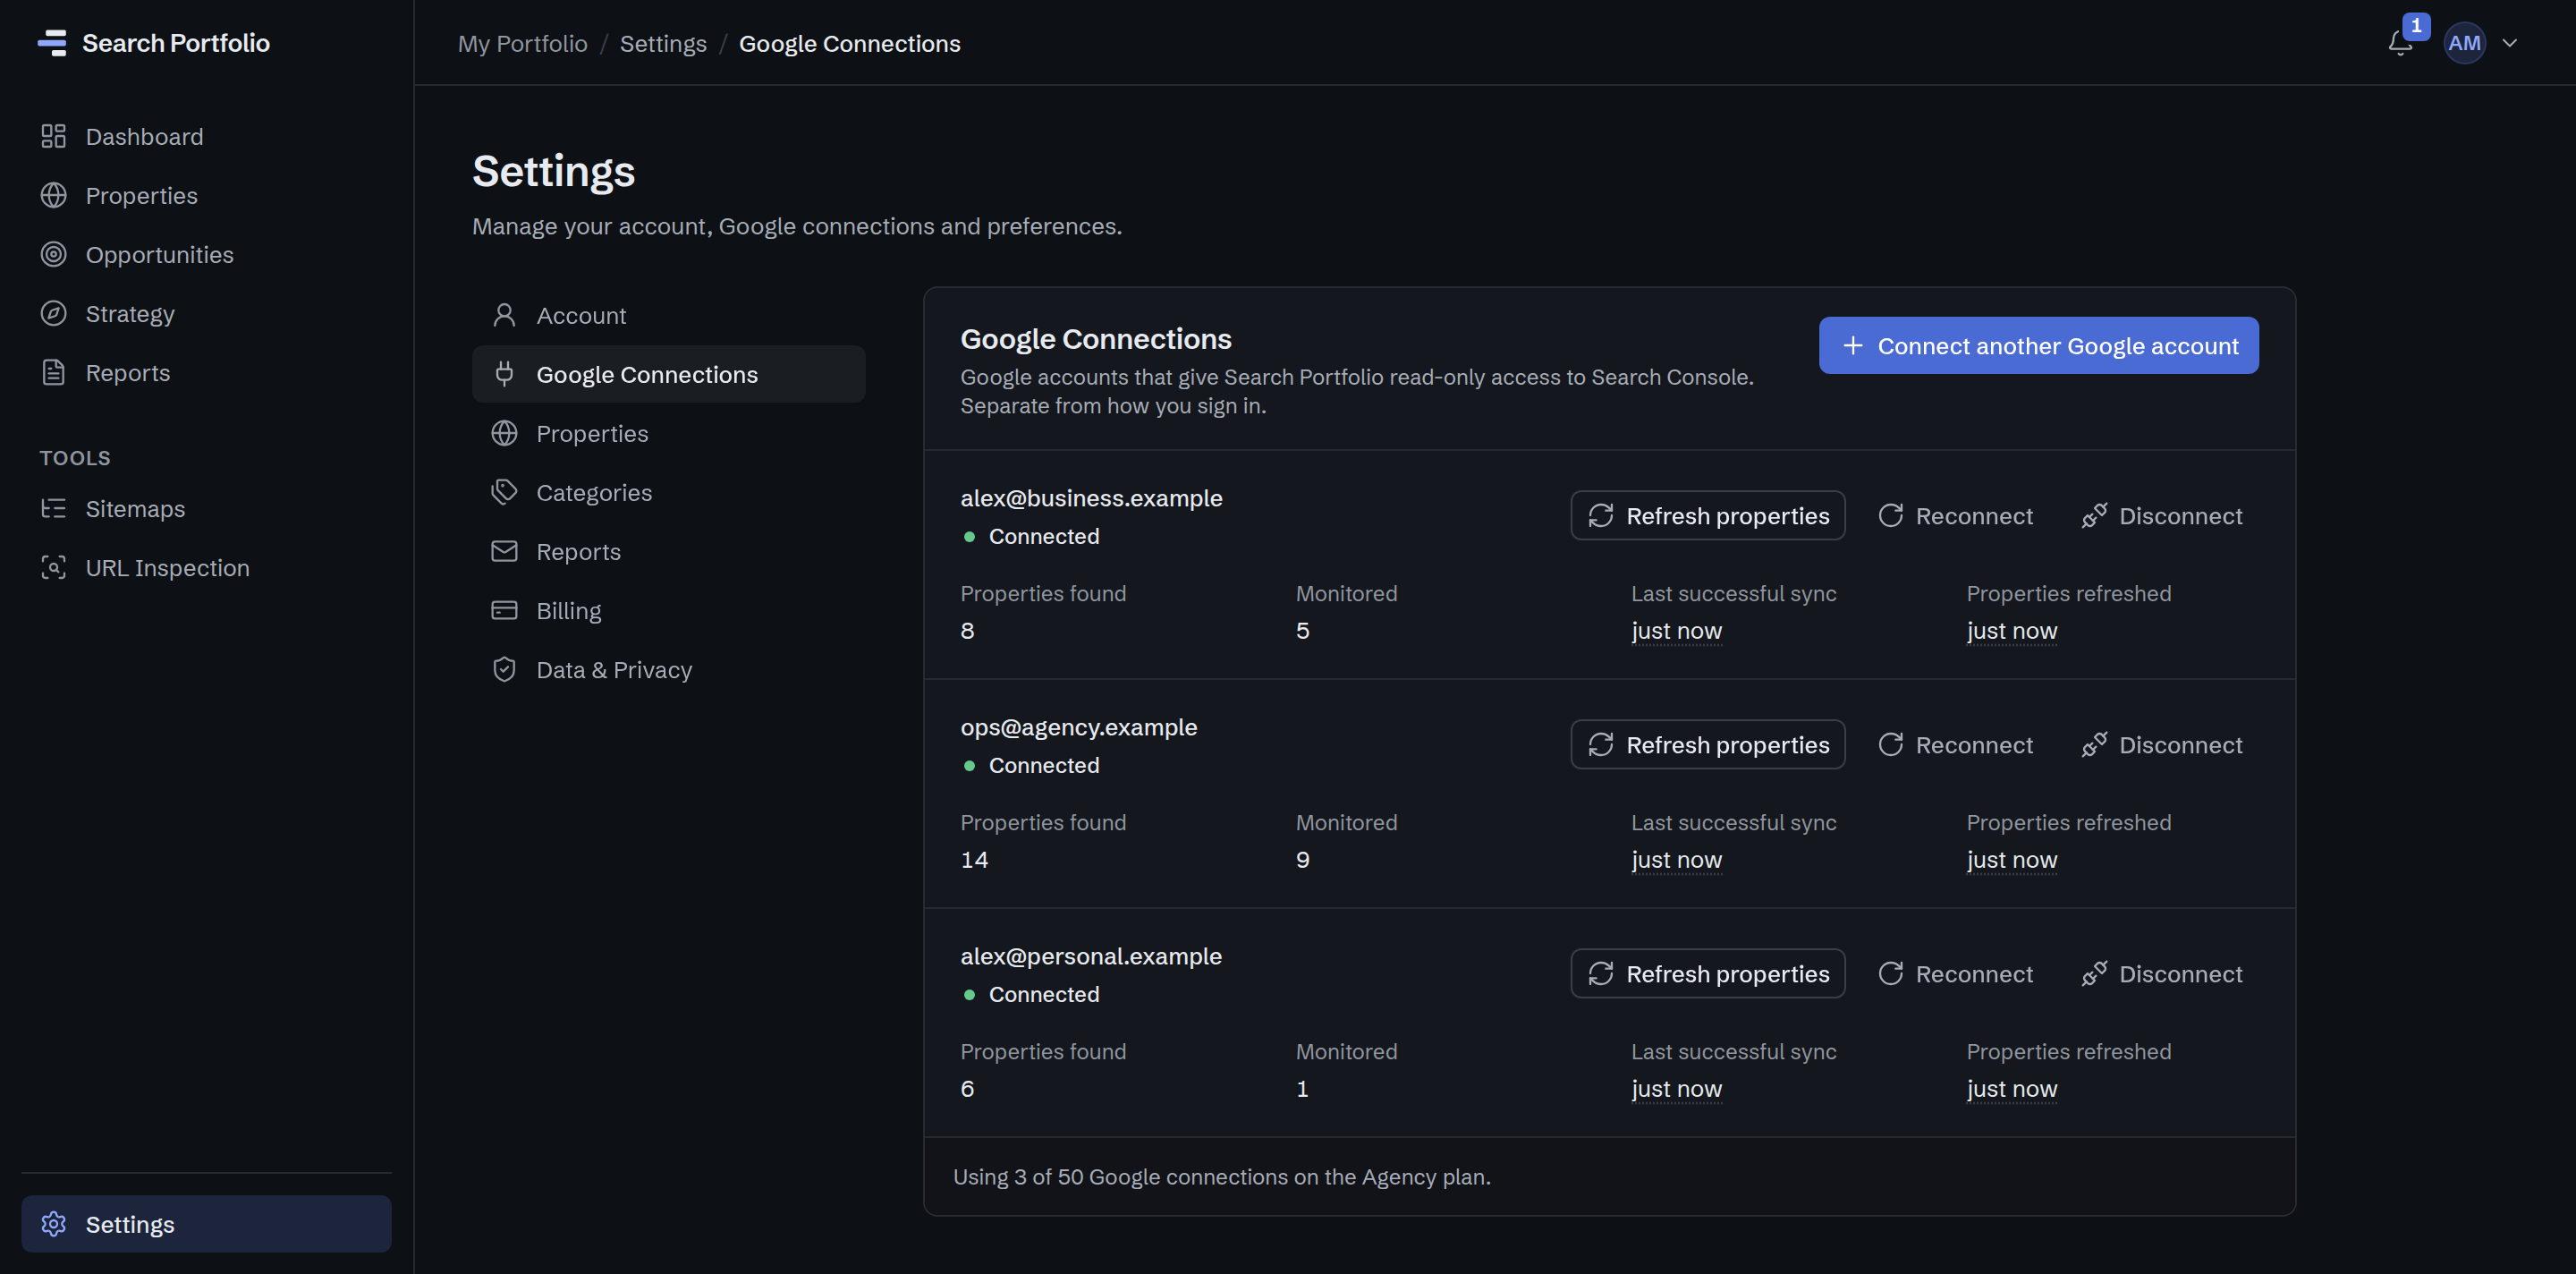
Settings → Google Connections: 3 Google accounts connected with read-only access to Search Console (alex@business.example: 8 properties found; ops@agency.example: 14 properties found; alex@personal.example: 6 properties found), each with how many of its properties are monitored and when it last synced.
Settings · Google ConnectionsProduct screenshot · example data

Organize Your Portfolio

Categorize websites and instantly analyze specific parts of your portfolio.

“How are my App Websites doing?”

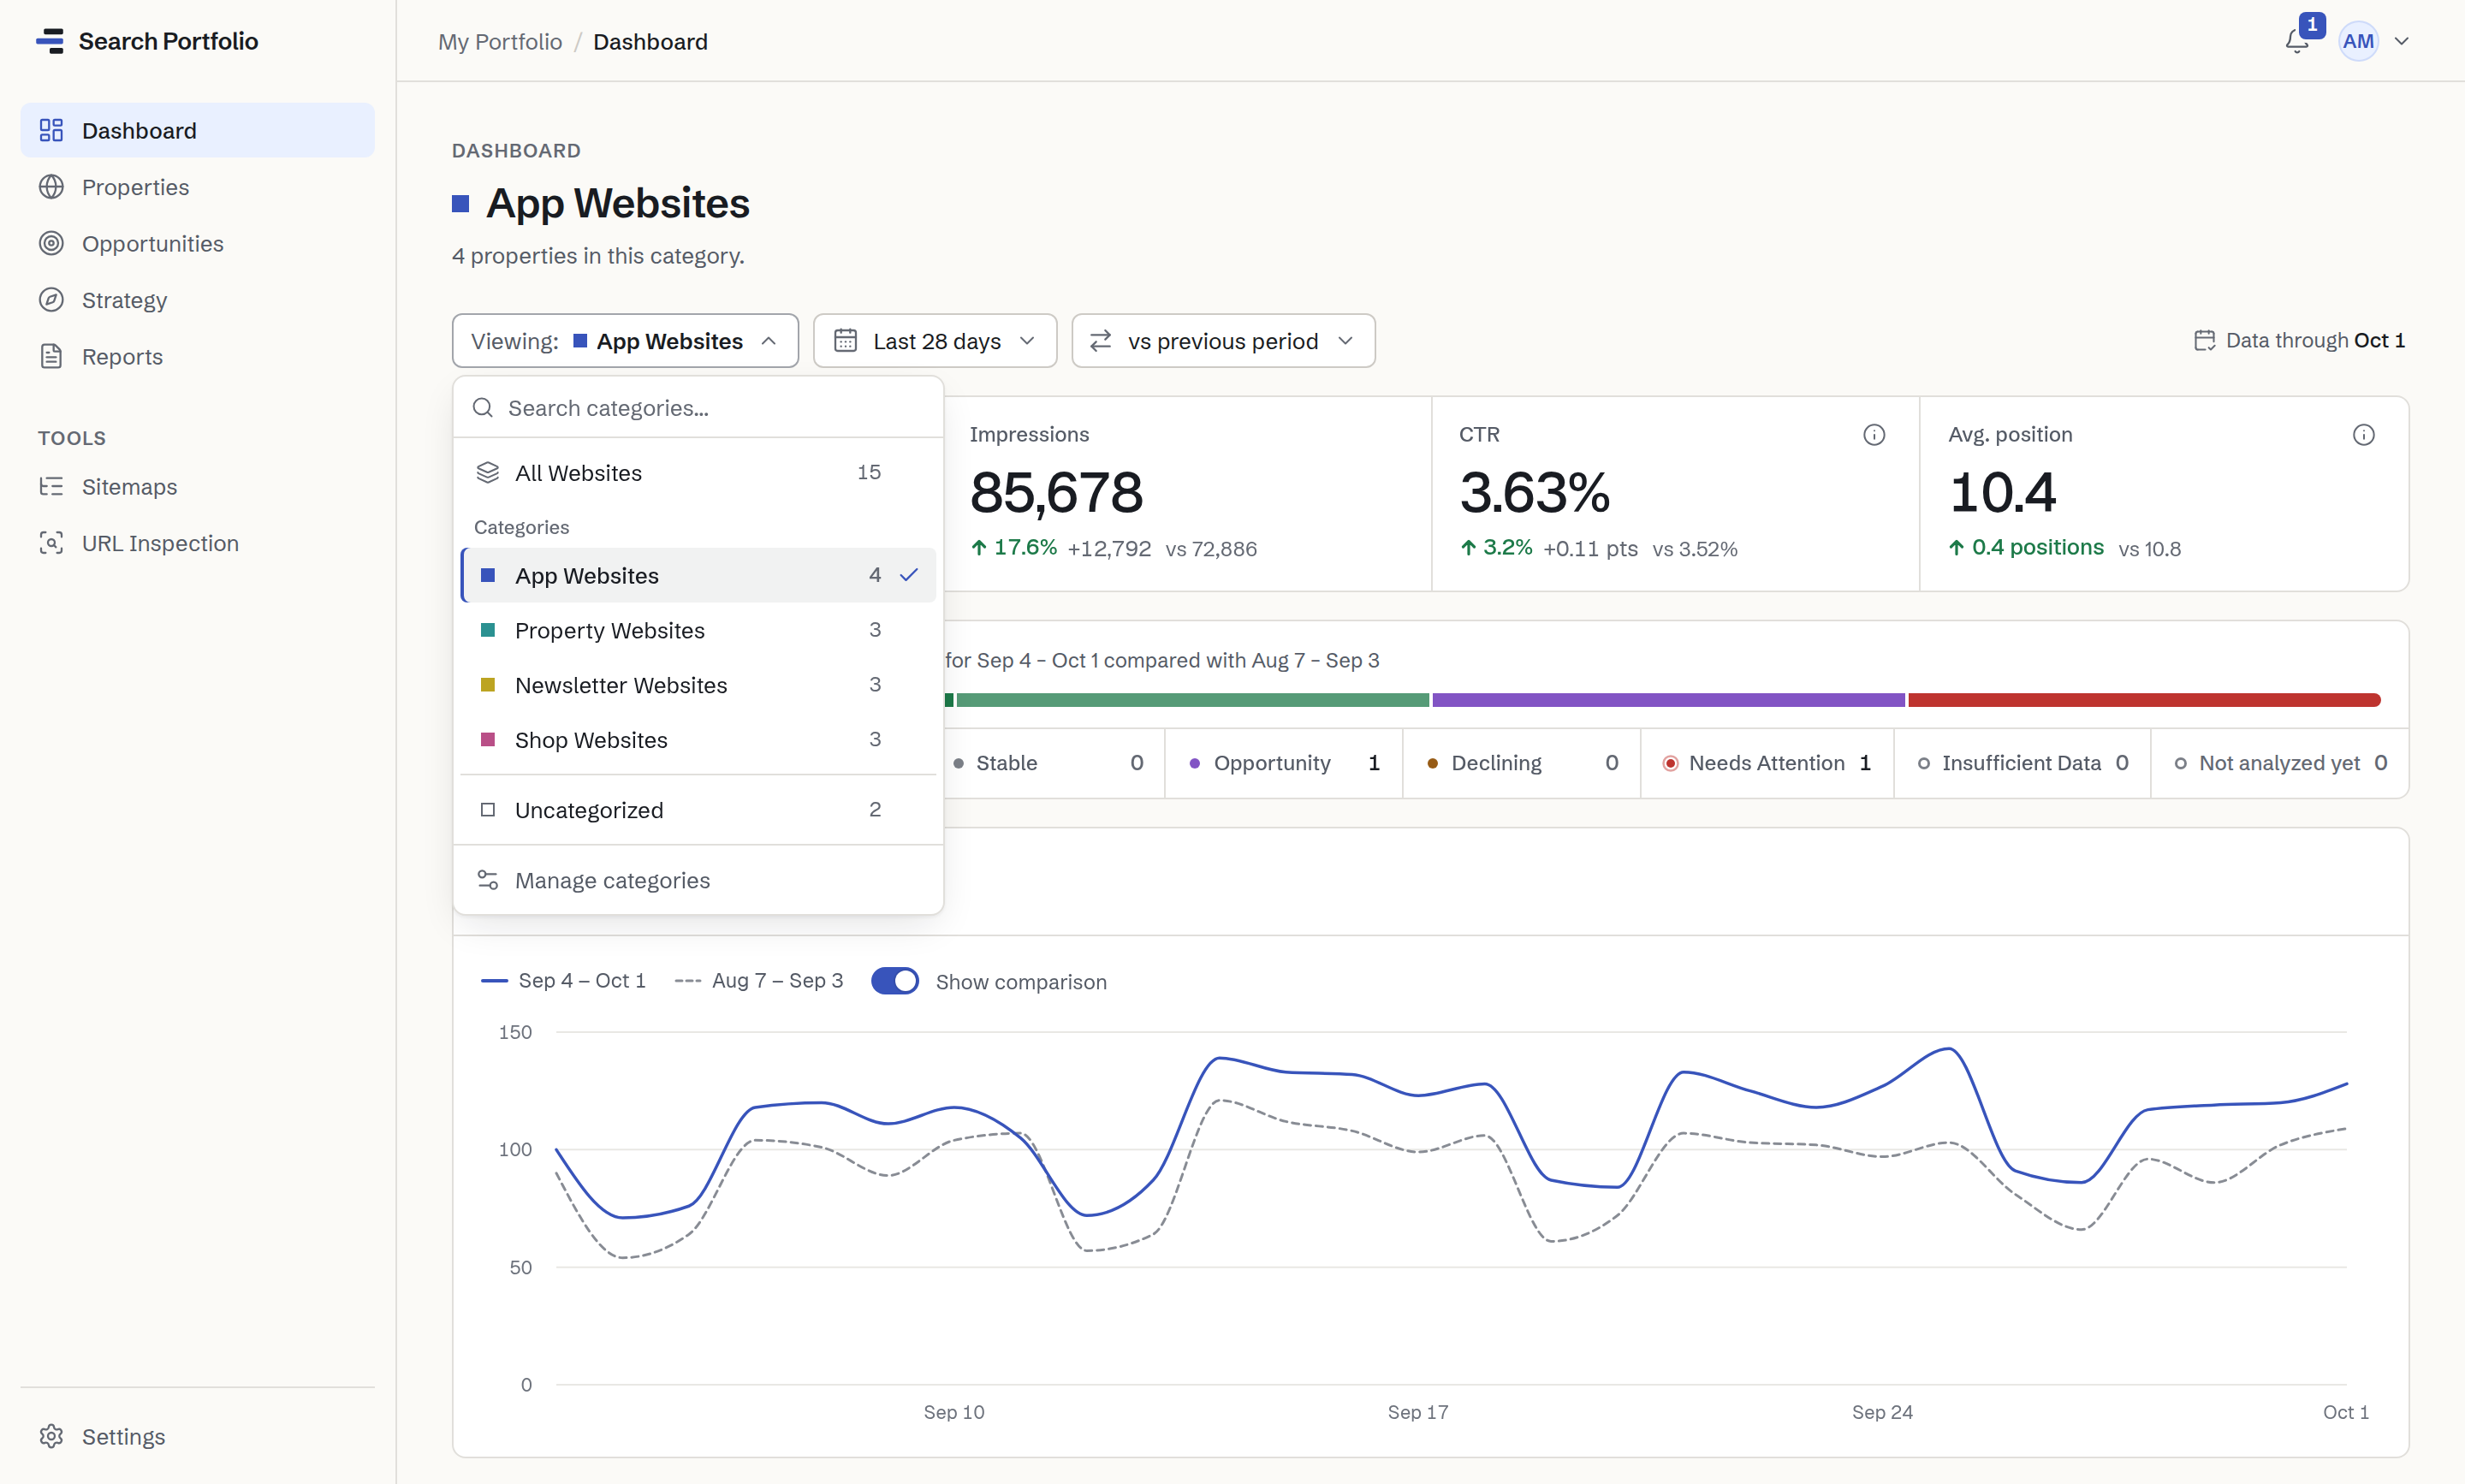
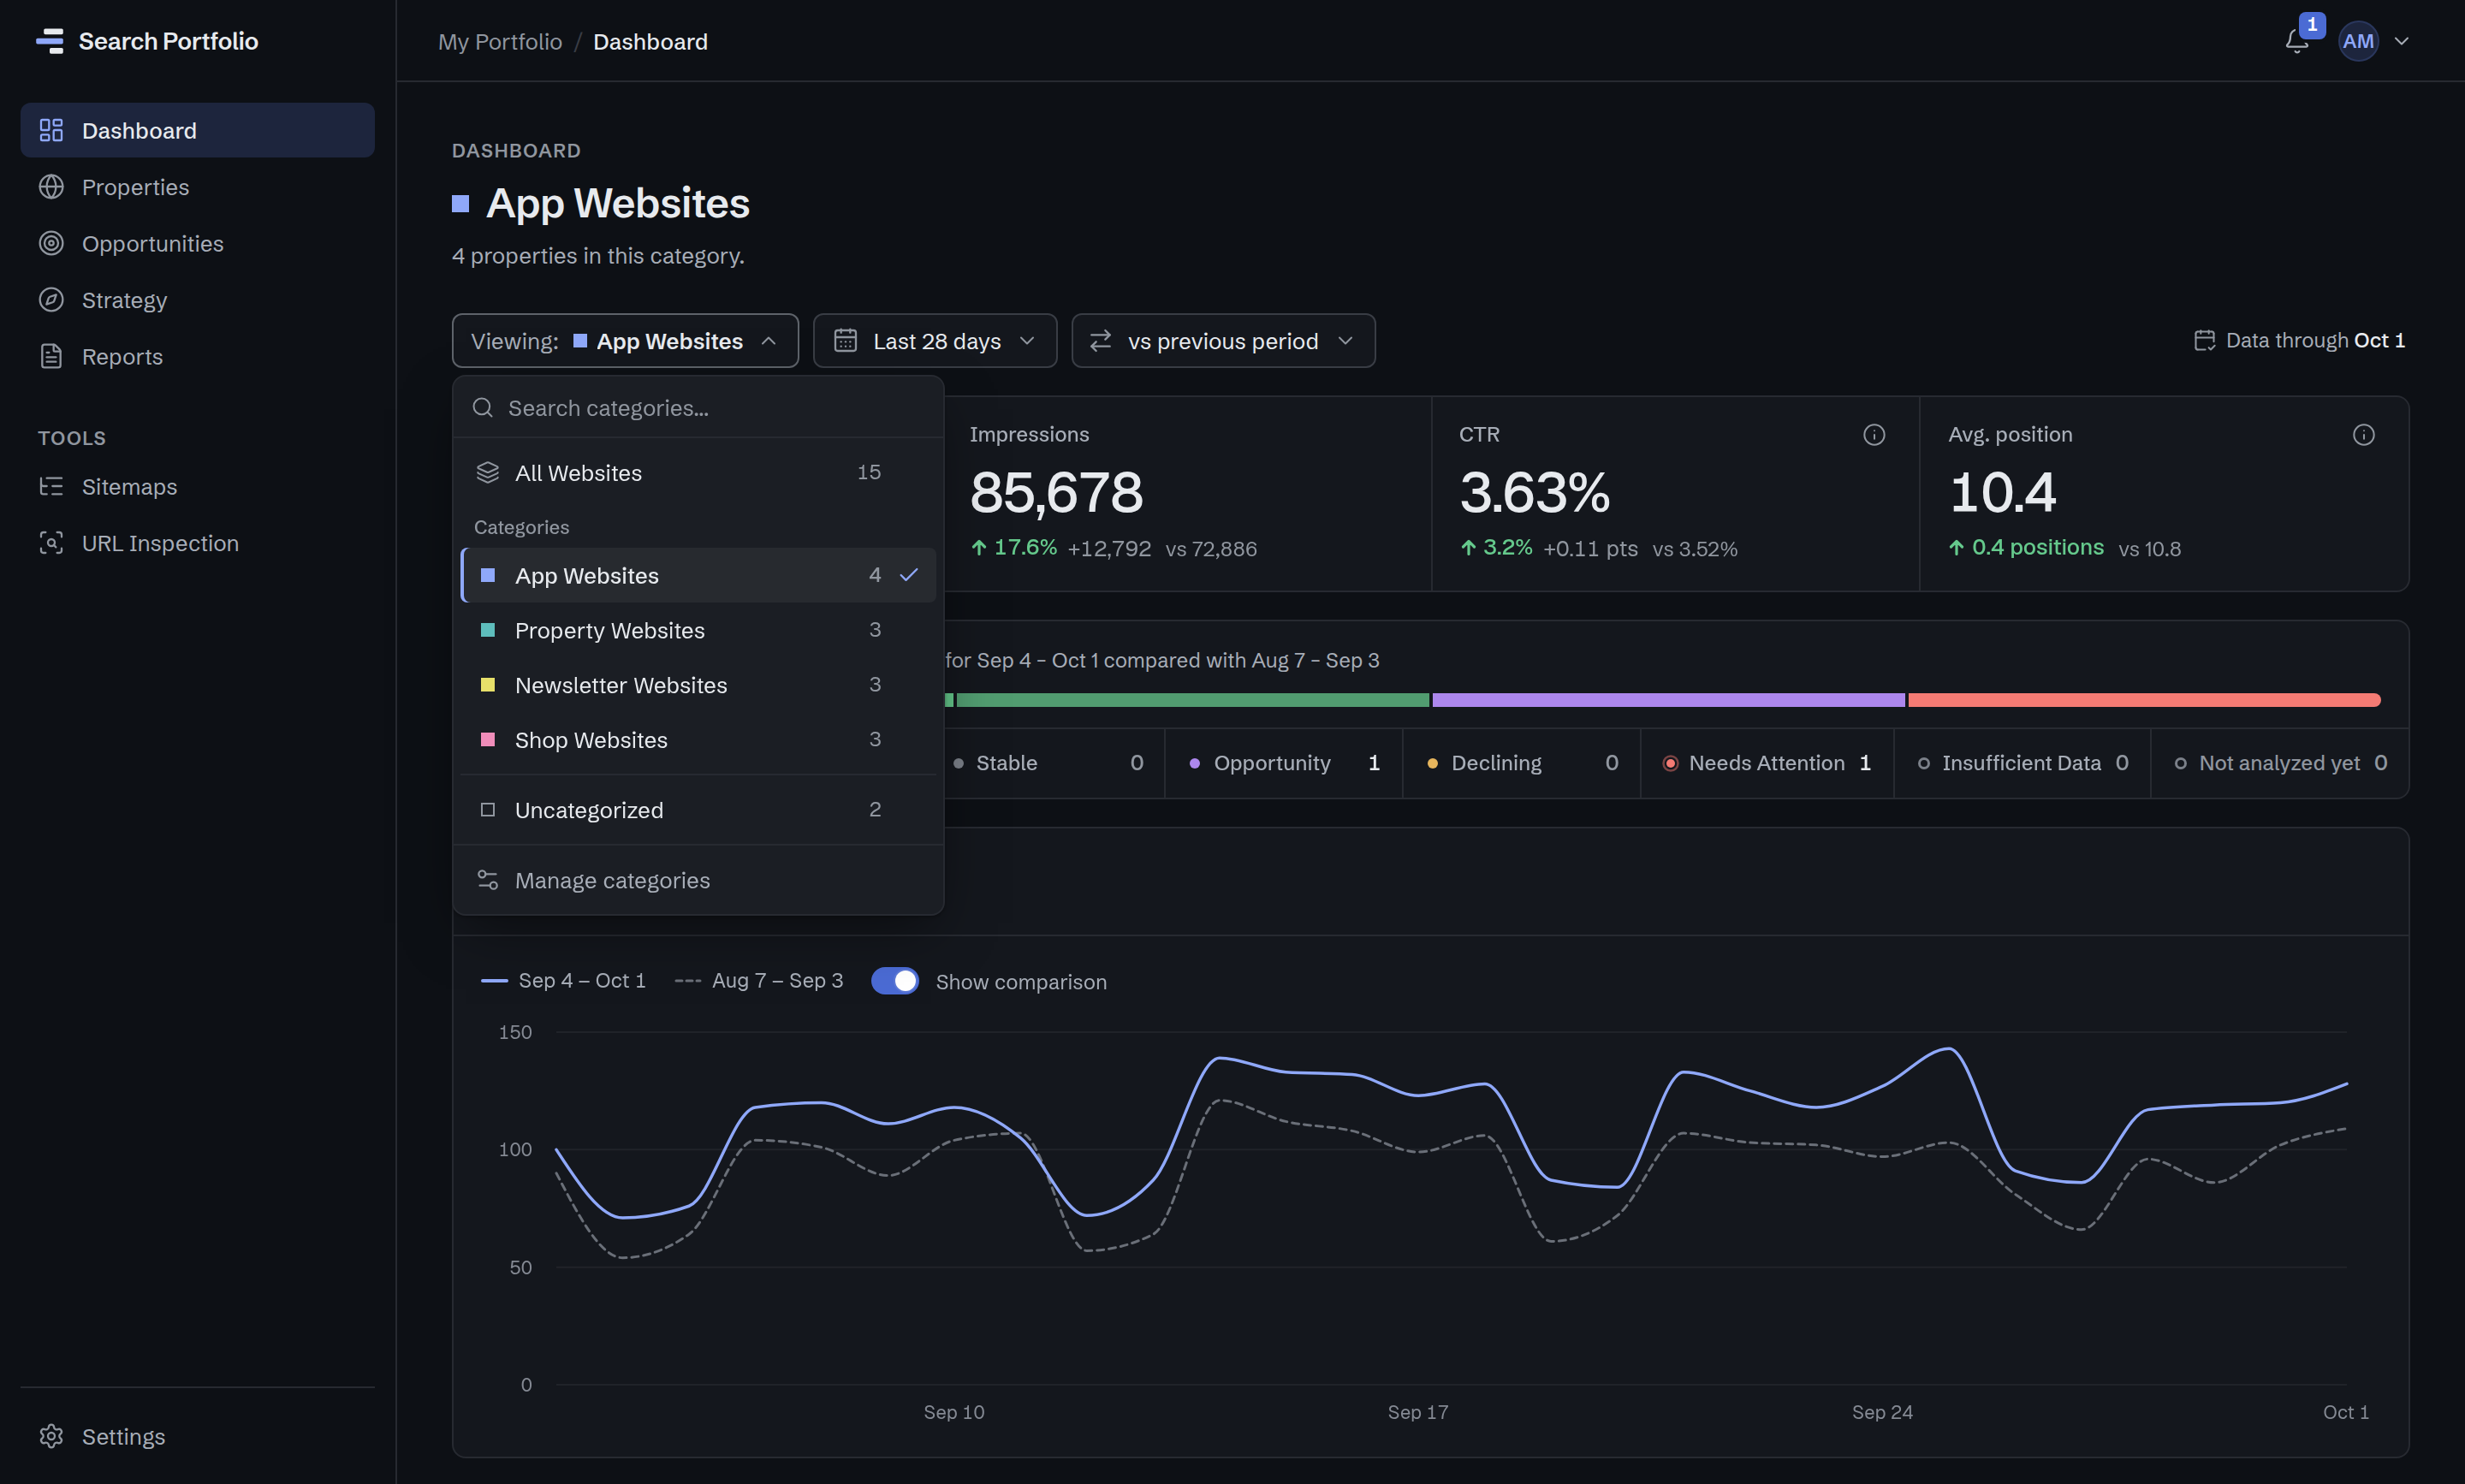
Choose App Websites in the Viewing switcher: totals, statuses, the trend, winners and declines recalculate for just those sites.

Your own categories.
App Websites, Client Sites, Newsletters: whatever matches how you work.
One switch, everywhere.
The dashboard, Opportunities and Strategy follow the category you pick; the weekly report covers each one.
On every plan.
Categories are included on Free, too.
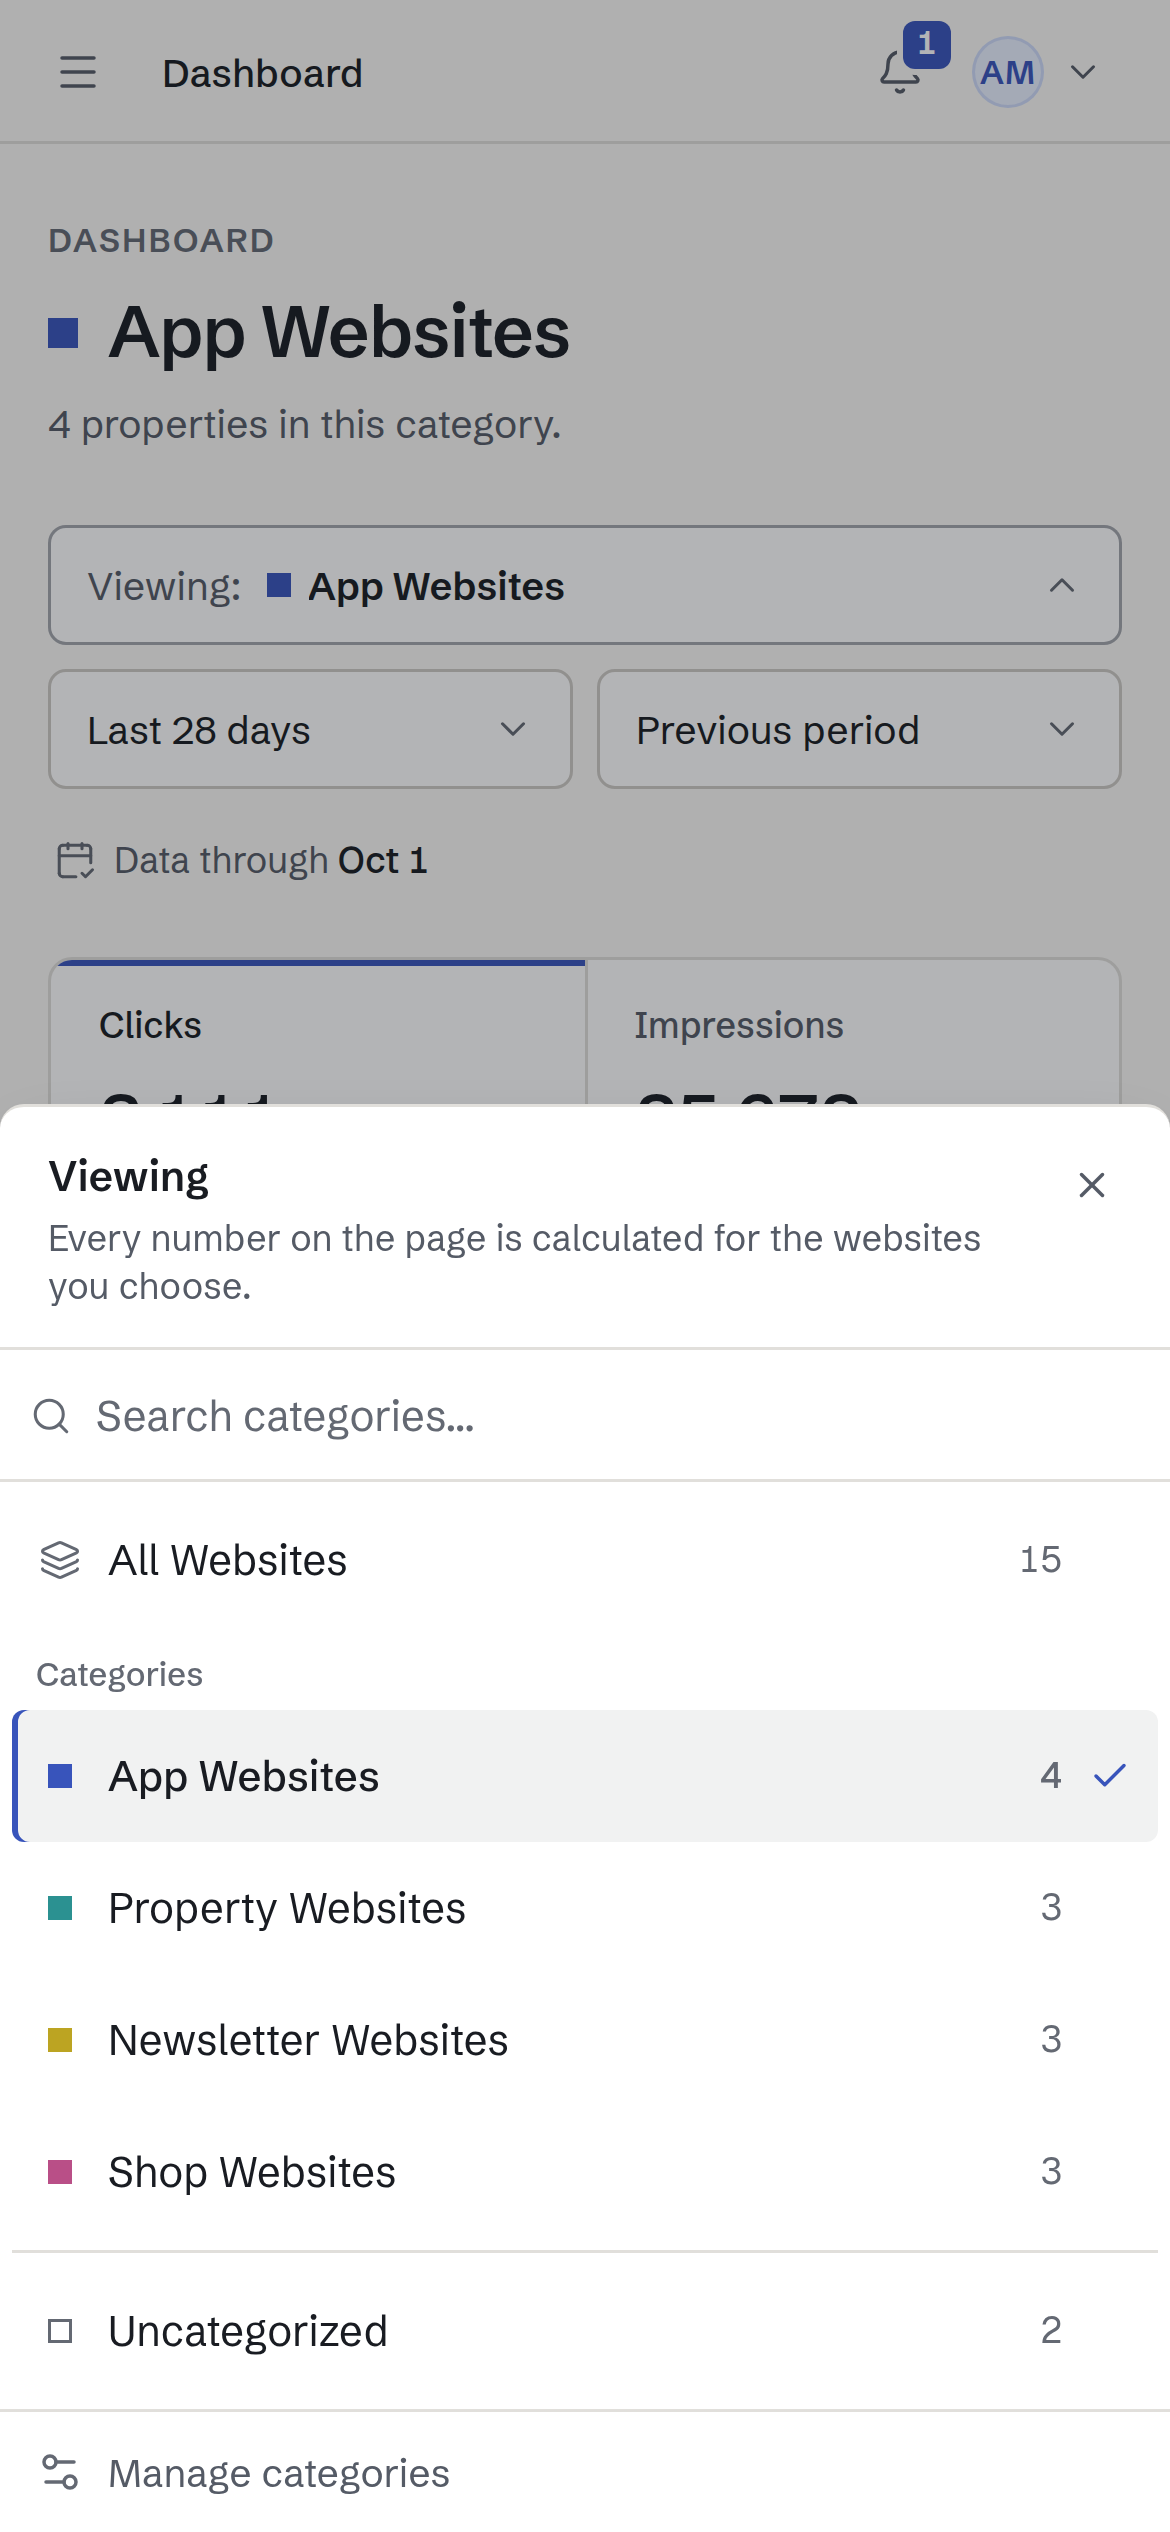
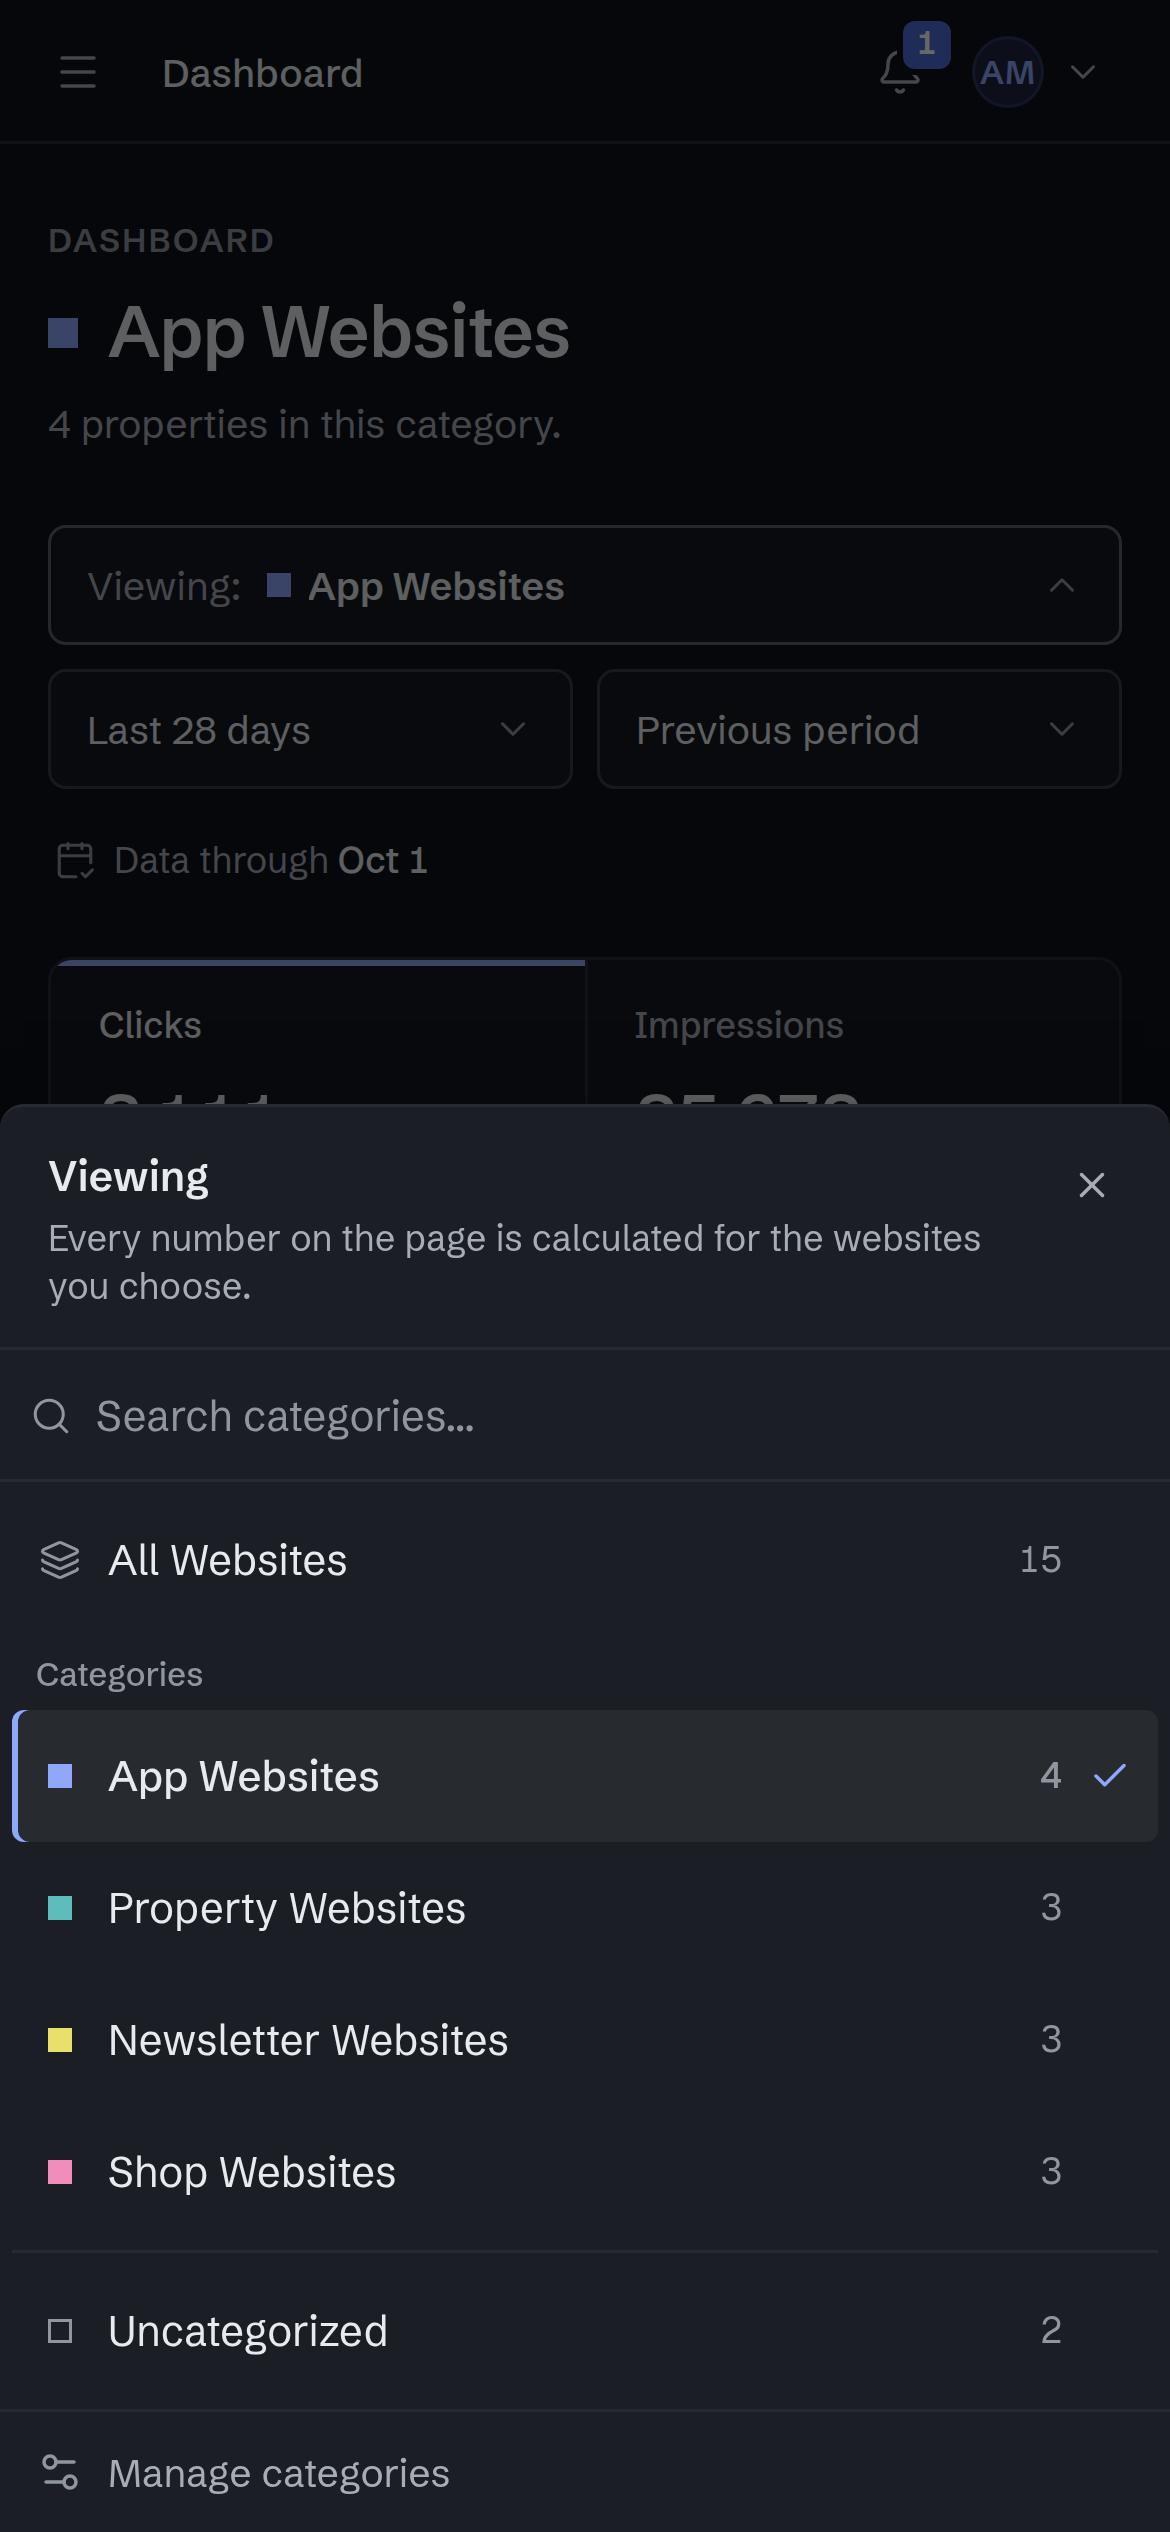
The category switcher on a phone, open as a sheet: "Every number on the page is calculated for the websites you choose." All Websites, App Websites, Property Websites, Newsletter Websites, Shop Websites and Uncategorized, each with its number of websites.
The dashboard's category switcher, open: All Websites, App Websites, Property Websites, Newsletter Websites, Shop Websites and Uncategorized, each with its number of websites. Choosing one switches the whole dashboard to that category.
Category switcherProduct screenshot · example data

Find Opportunities

Automatically surface ranking, CTR, page, and query opportunities.

Free shows your top 5 opportunities; Solo and up show every one.

Striking distance.
Queries averaging position 4–15 with real impressions, where a modest ranking gain may bring noticeably more clicks.
Click-through rate.
Queries earning fewer clicks than their position usually brings, judged from your own sites where there is enough data.
Declines, explained carefully.
Which pages lost clicks and a hedged reading of what may be behind it, never a verdict.
And more.
Ranking losses, breakouts, new and lost visibility, page opportunities, possible cannibalization and cross-site overlap.
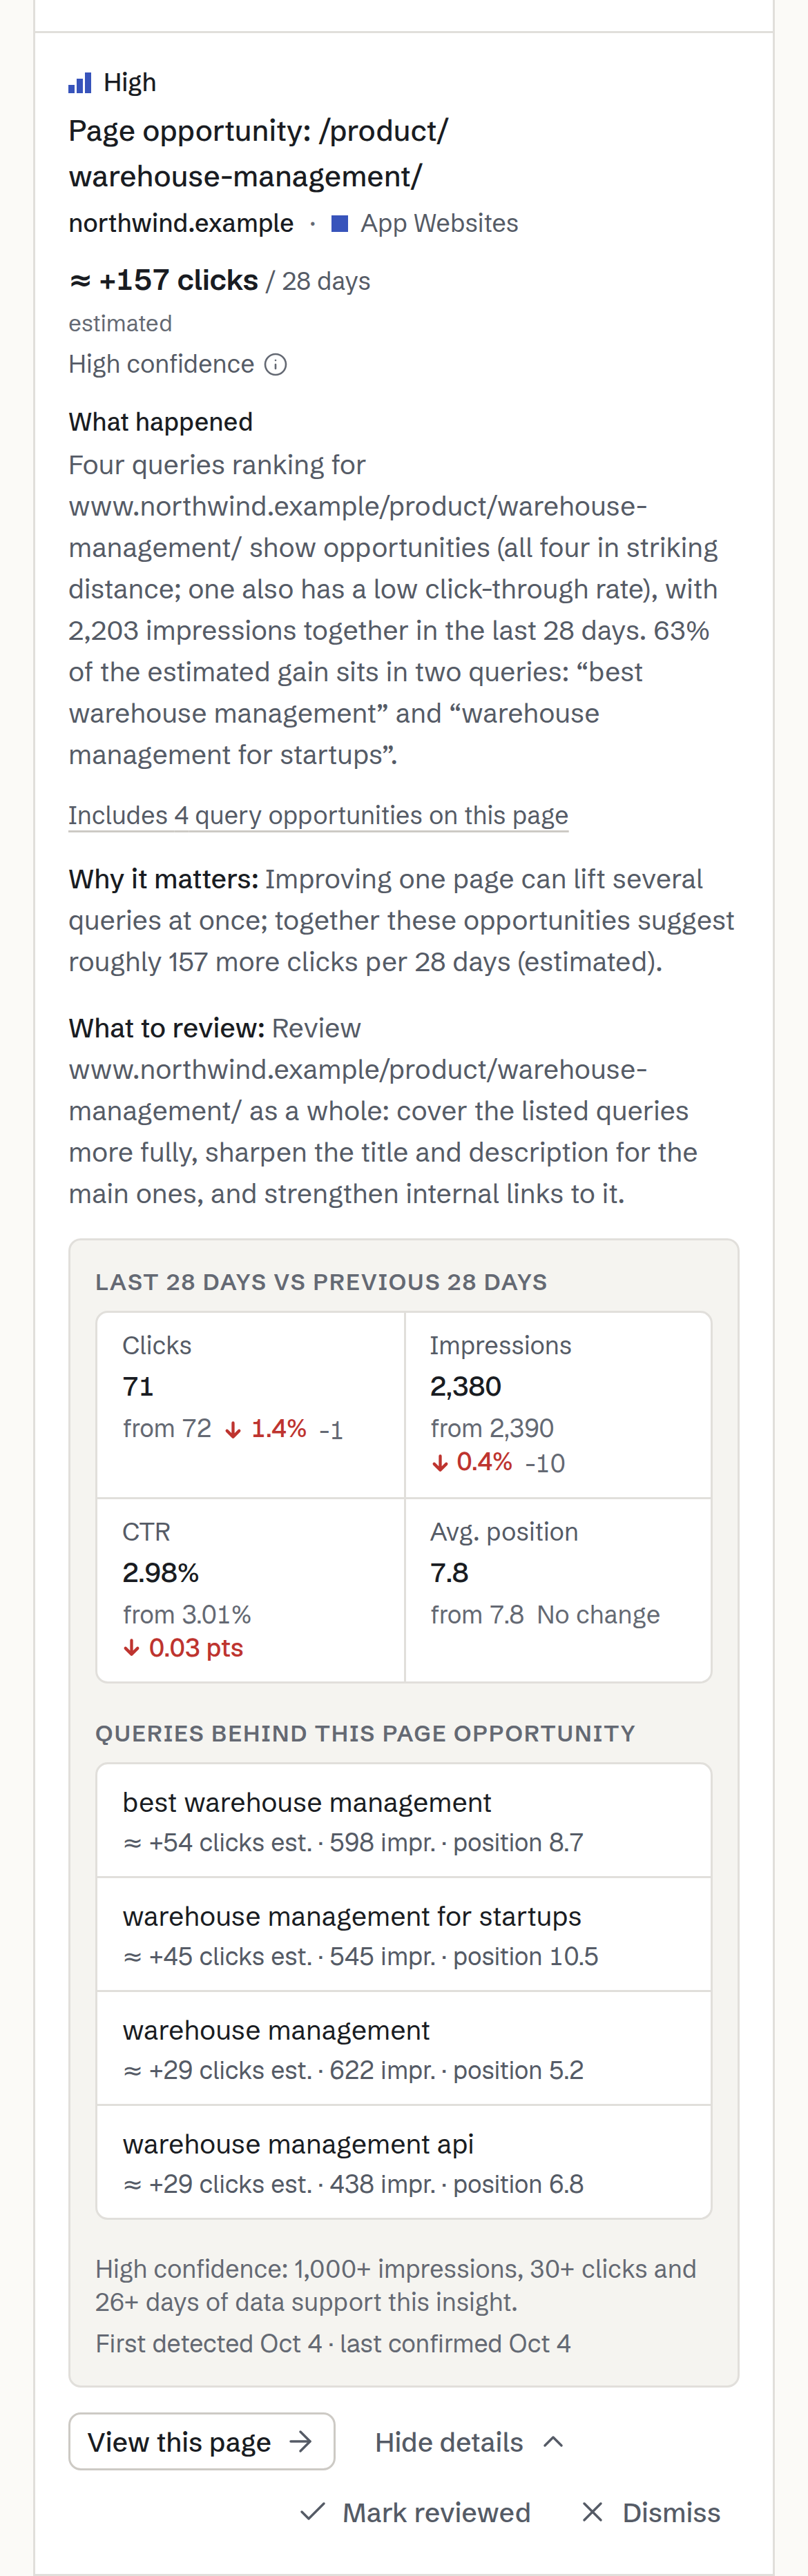
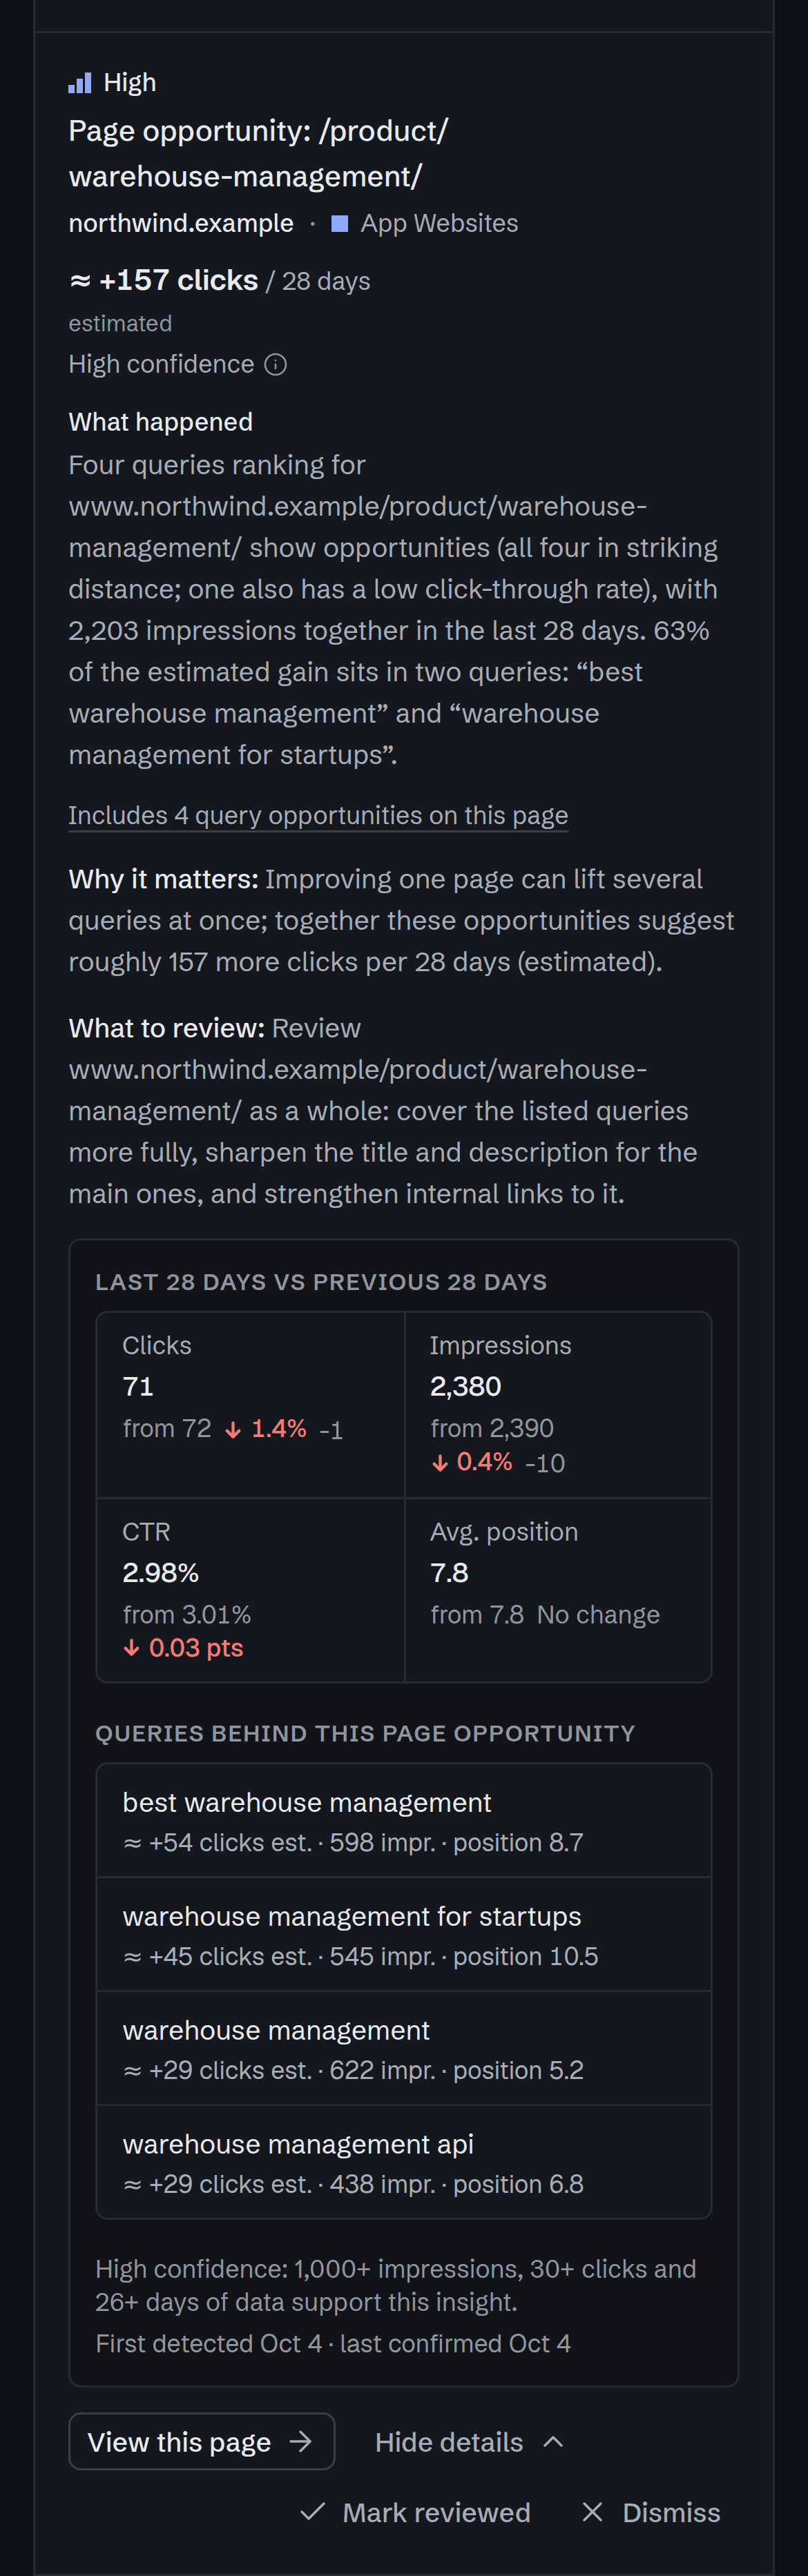
A page opportunity on a phone, “Page opportunity: /product/warehouse-management/” on northwind.example: about 157 more clicks per 28 days (estimated), high confidence, then what happened, why it matters and what to review.
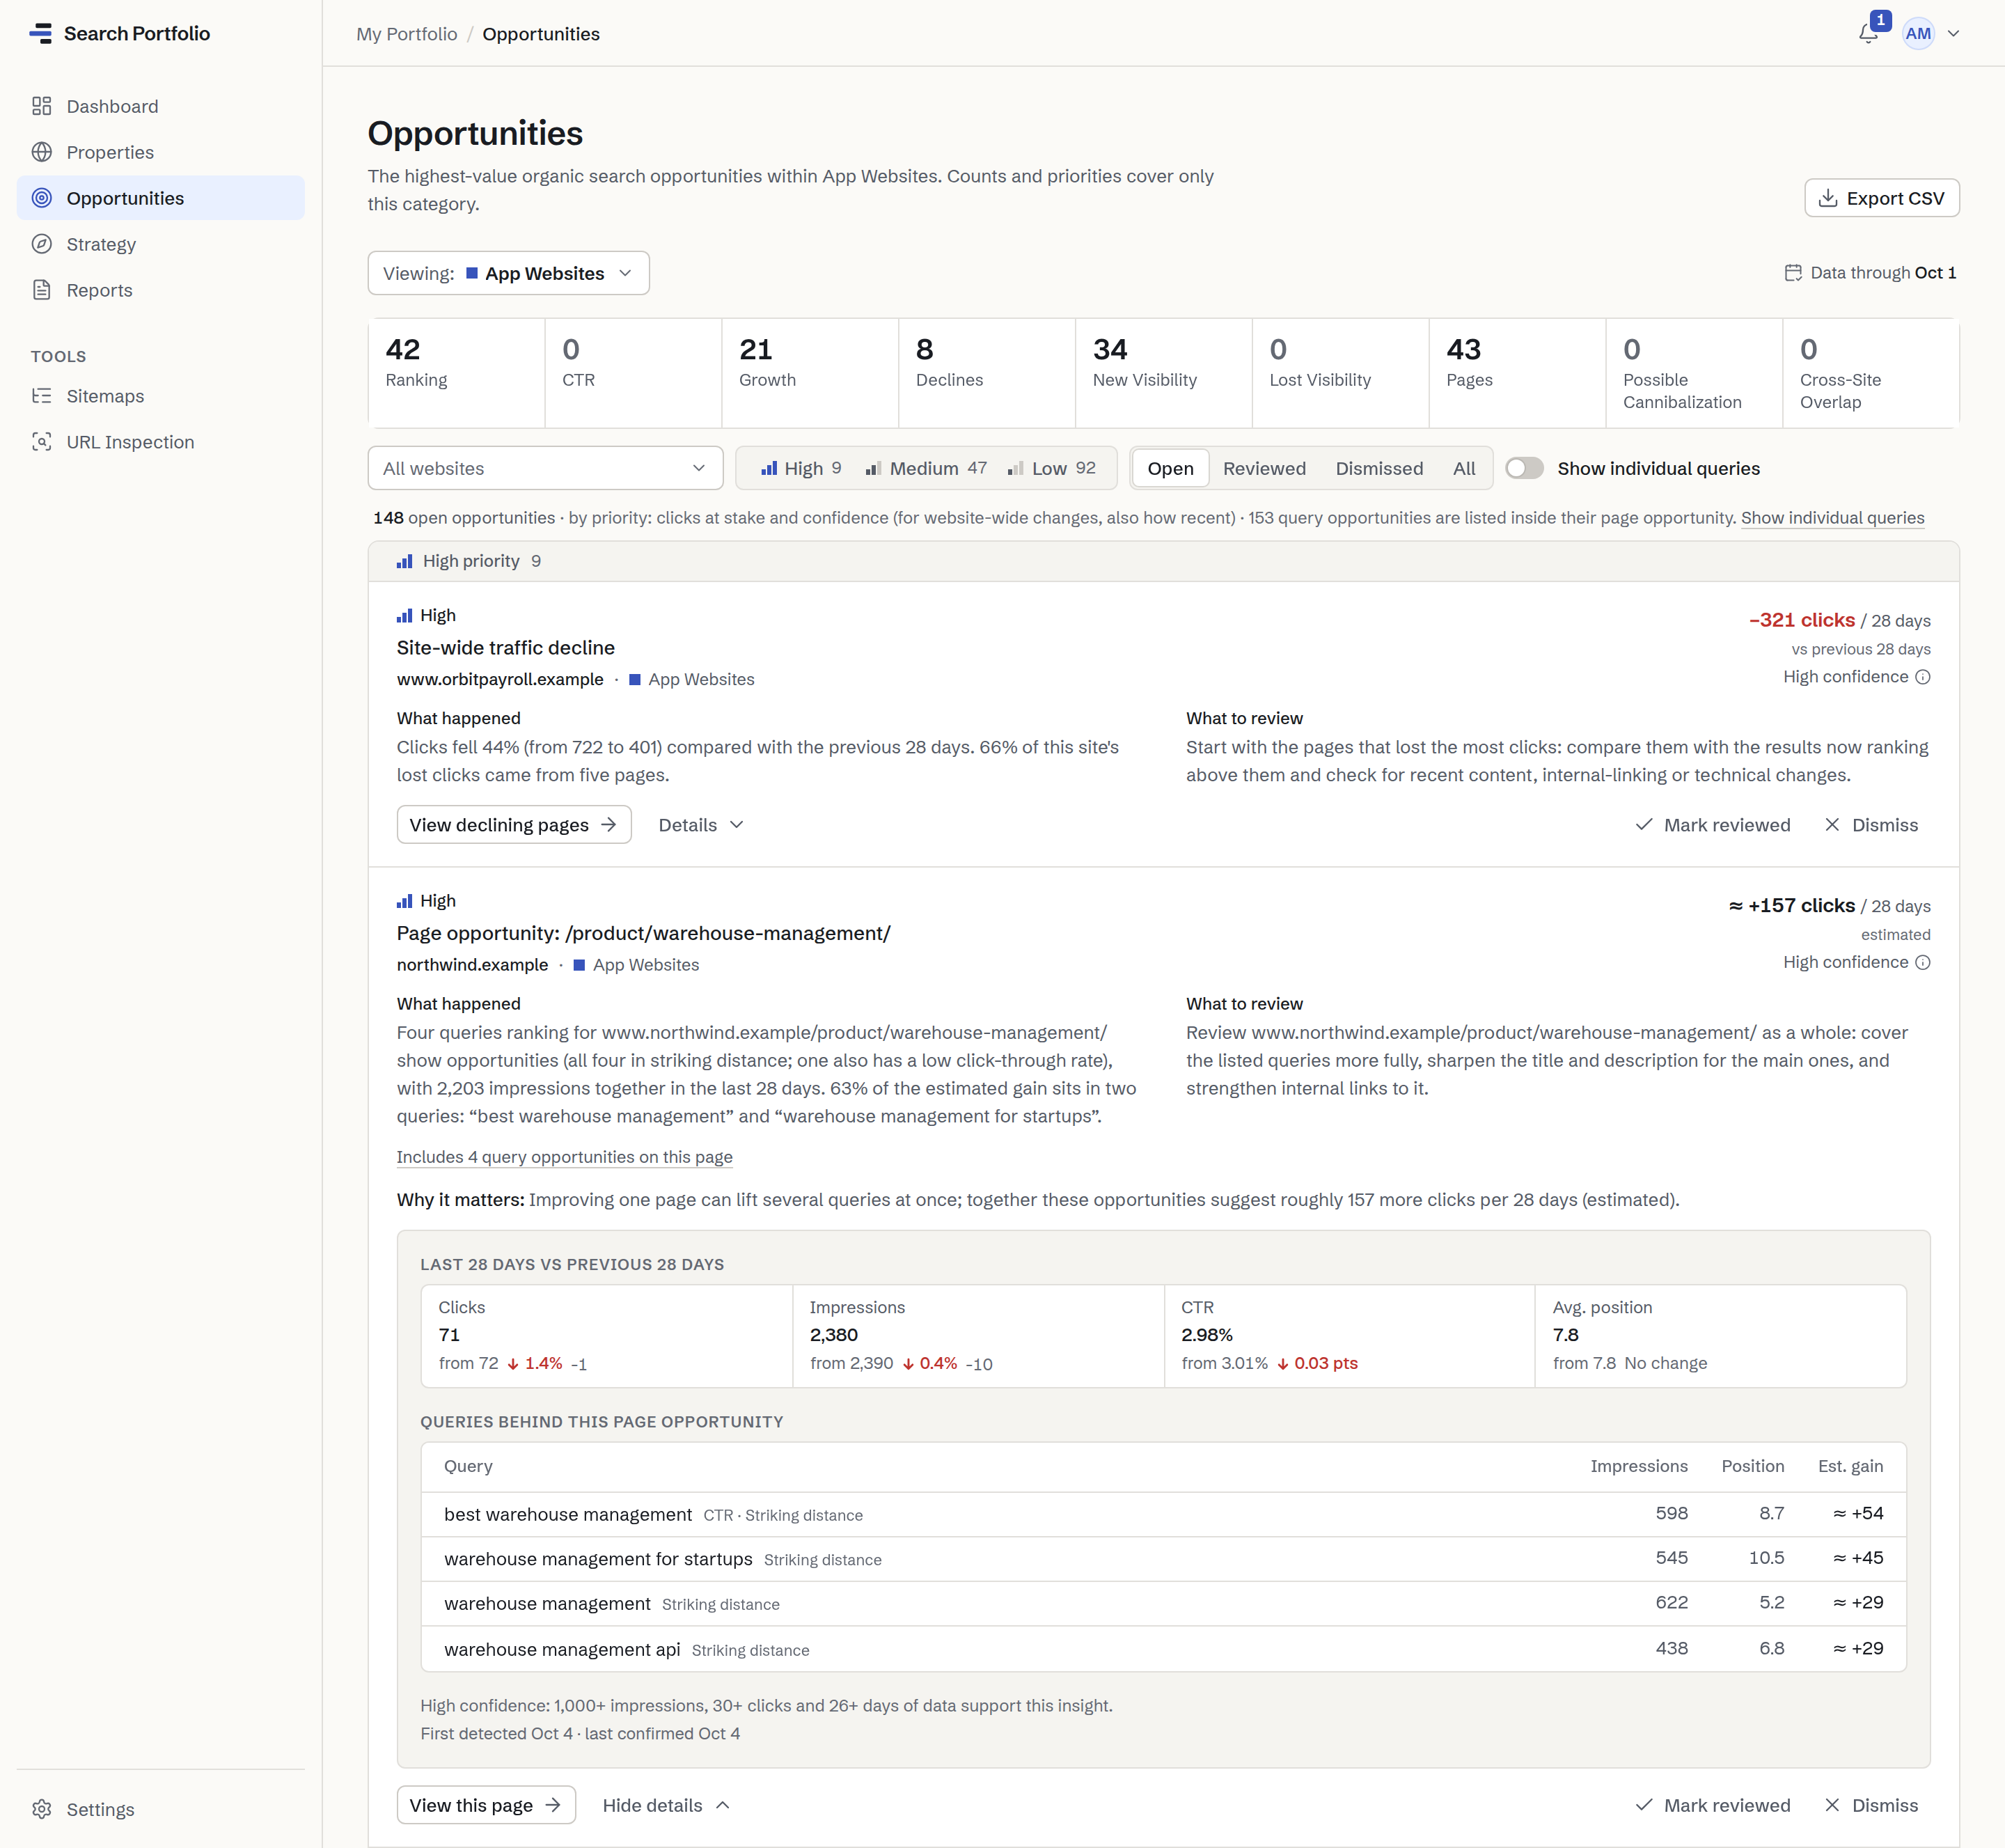
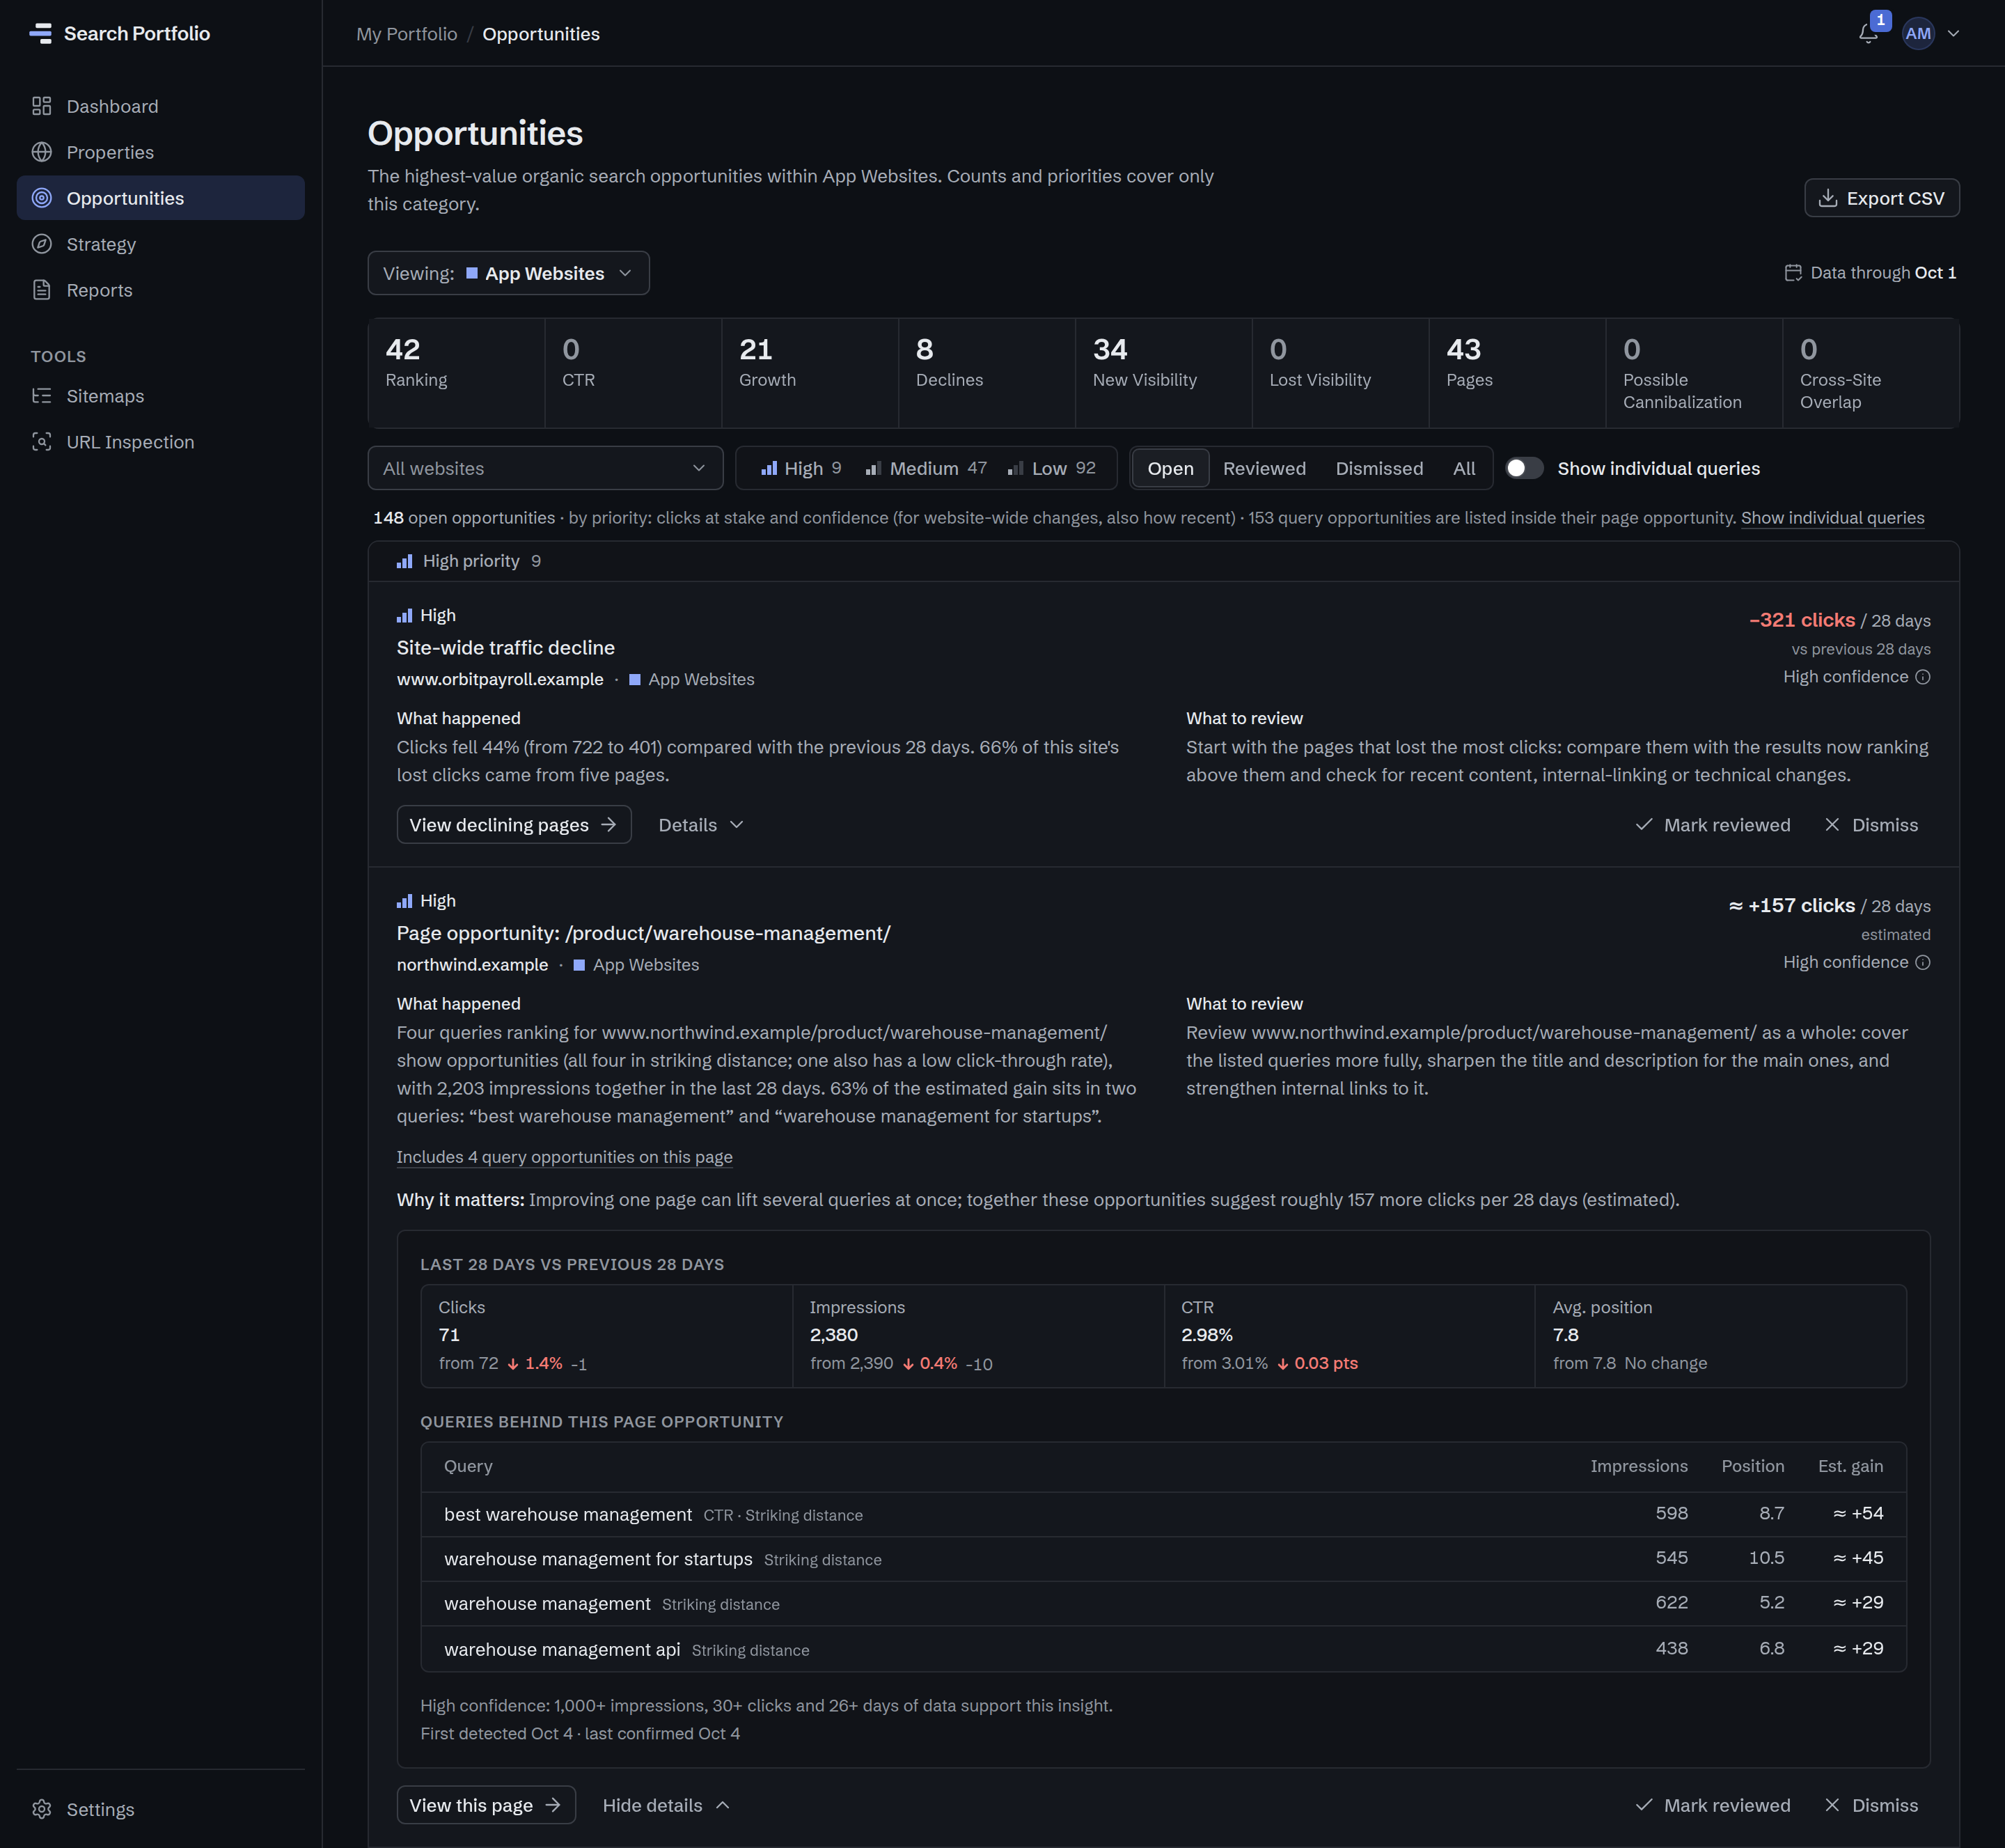
A page opportunity in the Opportunity Center, expanded: “Page opportunity: /product/warehouse-management/” on northwind.example, about 157 more clicks per 28 days (estimated) with high confidence. It states what happened, what to review and why it matters, then the page’s last 28 days against the previous 28, the four queries behind it with their impressions, position and estimated gain, and the basis for its confidence: 1,000+ impressions, 30+ clicks and 26+ days of data.
Opportunity Center · a page opportunity, expandedProduct screenshot · example data

Every opportunity states what happened, why it matters and what to review, with the numbers behind it and a confidence level. Mark it reviewed or dismiss it, and the list stays focused on what is still open.

Know What Needs Attention

Identify major declines and emerging winners.

Strategy is included from Solo ($9 a month).

Top 10 things worth your attention.
Strategy ranks what changed across the portfolio, or one category, by likely impact and confidence.
Impact, not just percentages.
Winners and declines are ranked by clicks gained or lost.
Noise left out.
Changes need real volume as well as a big percentage; sites with fewer than 200 impressions in 28 days are marked Insufficient Data.
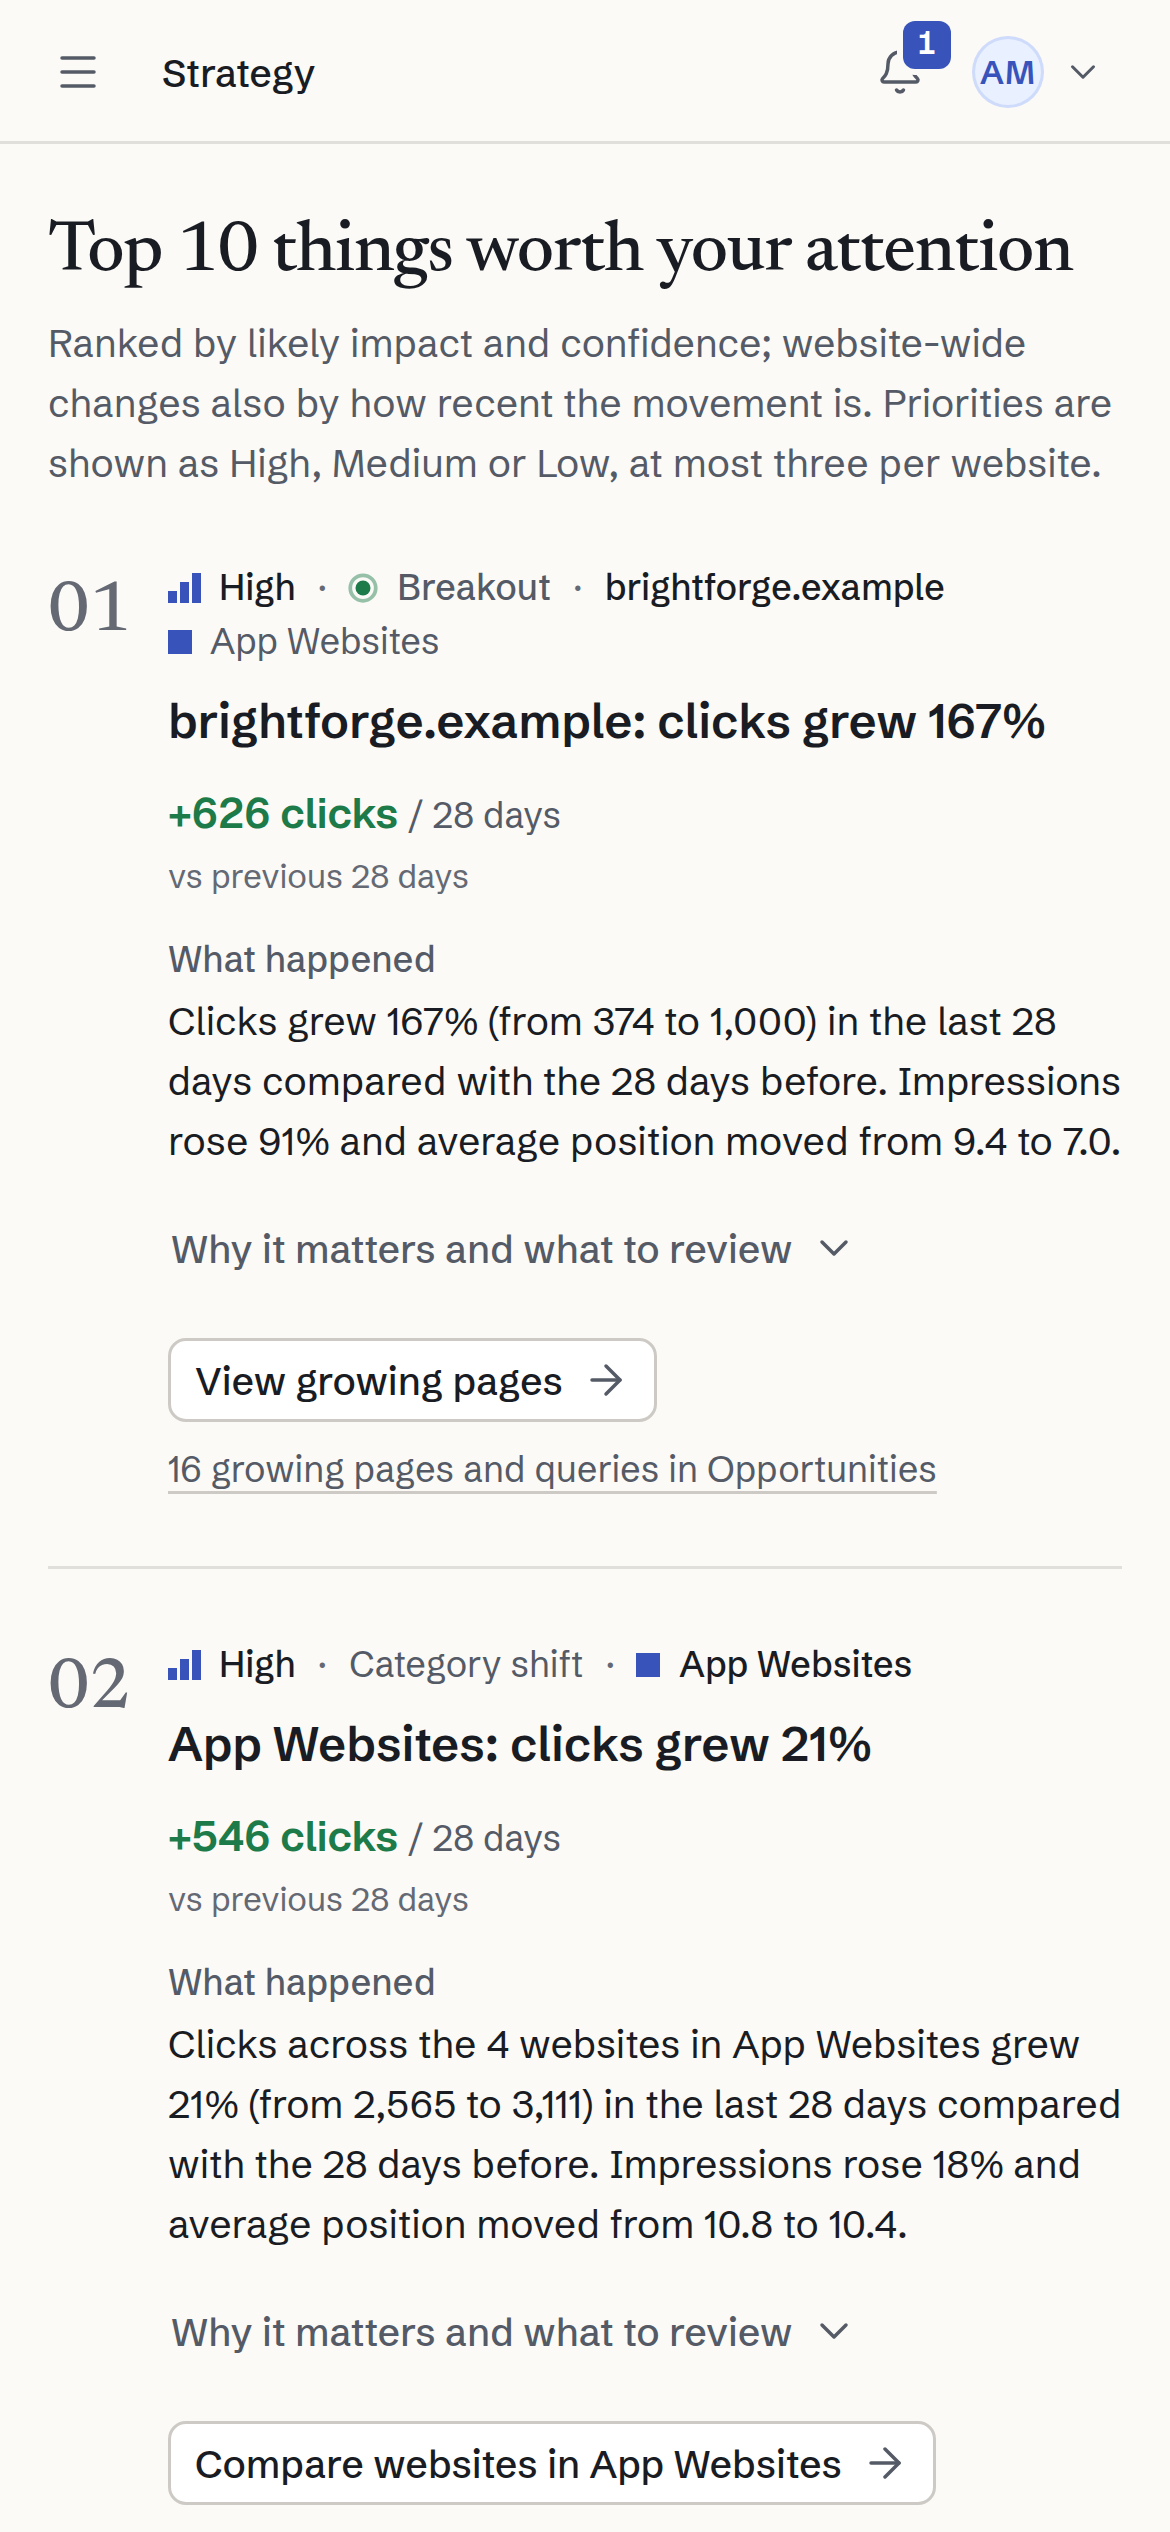
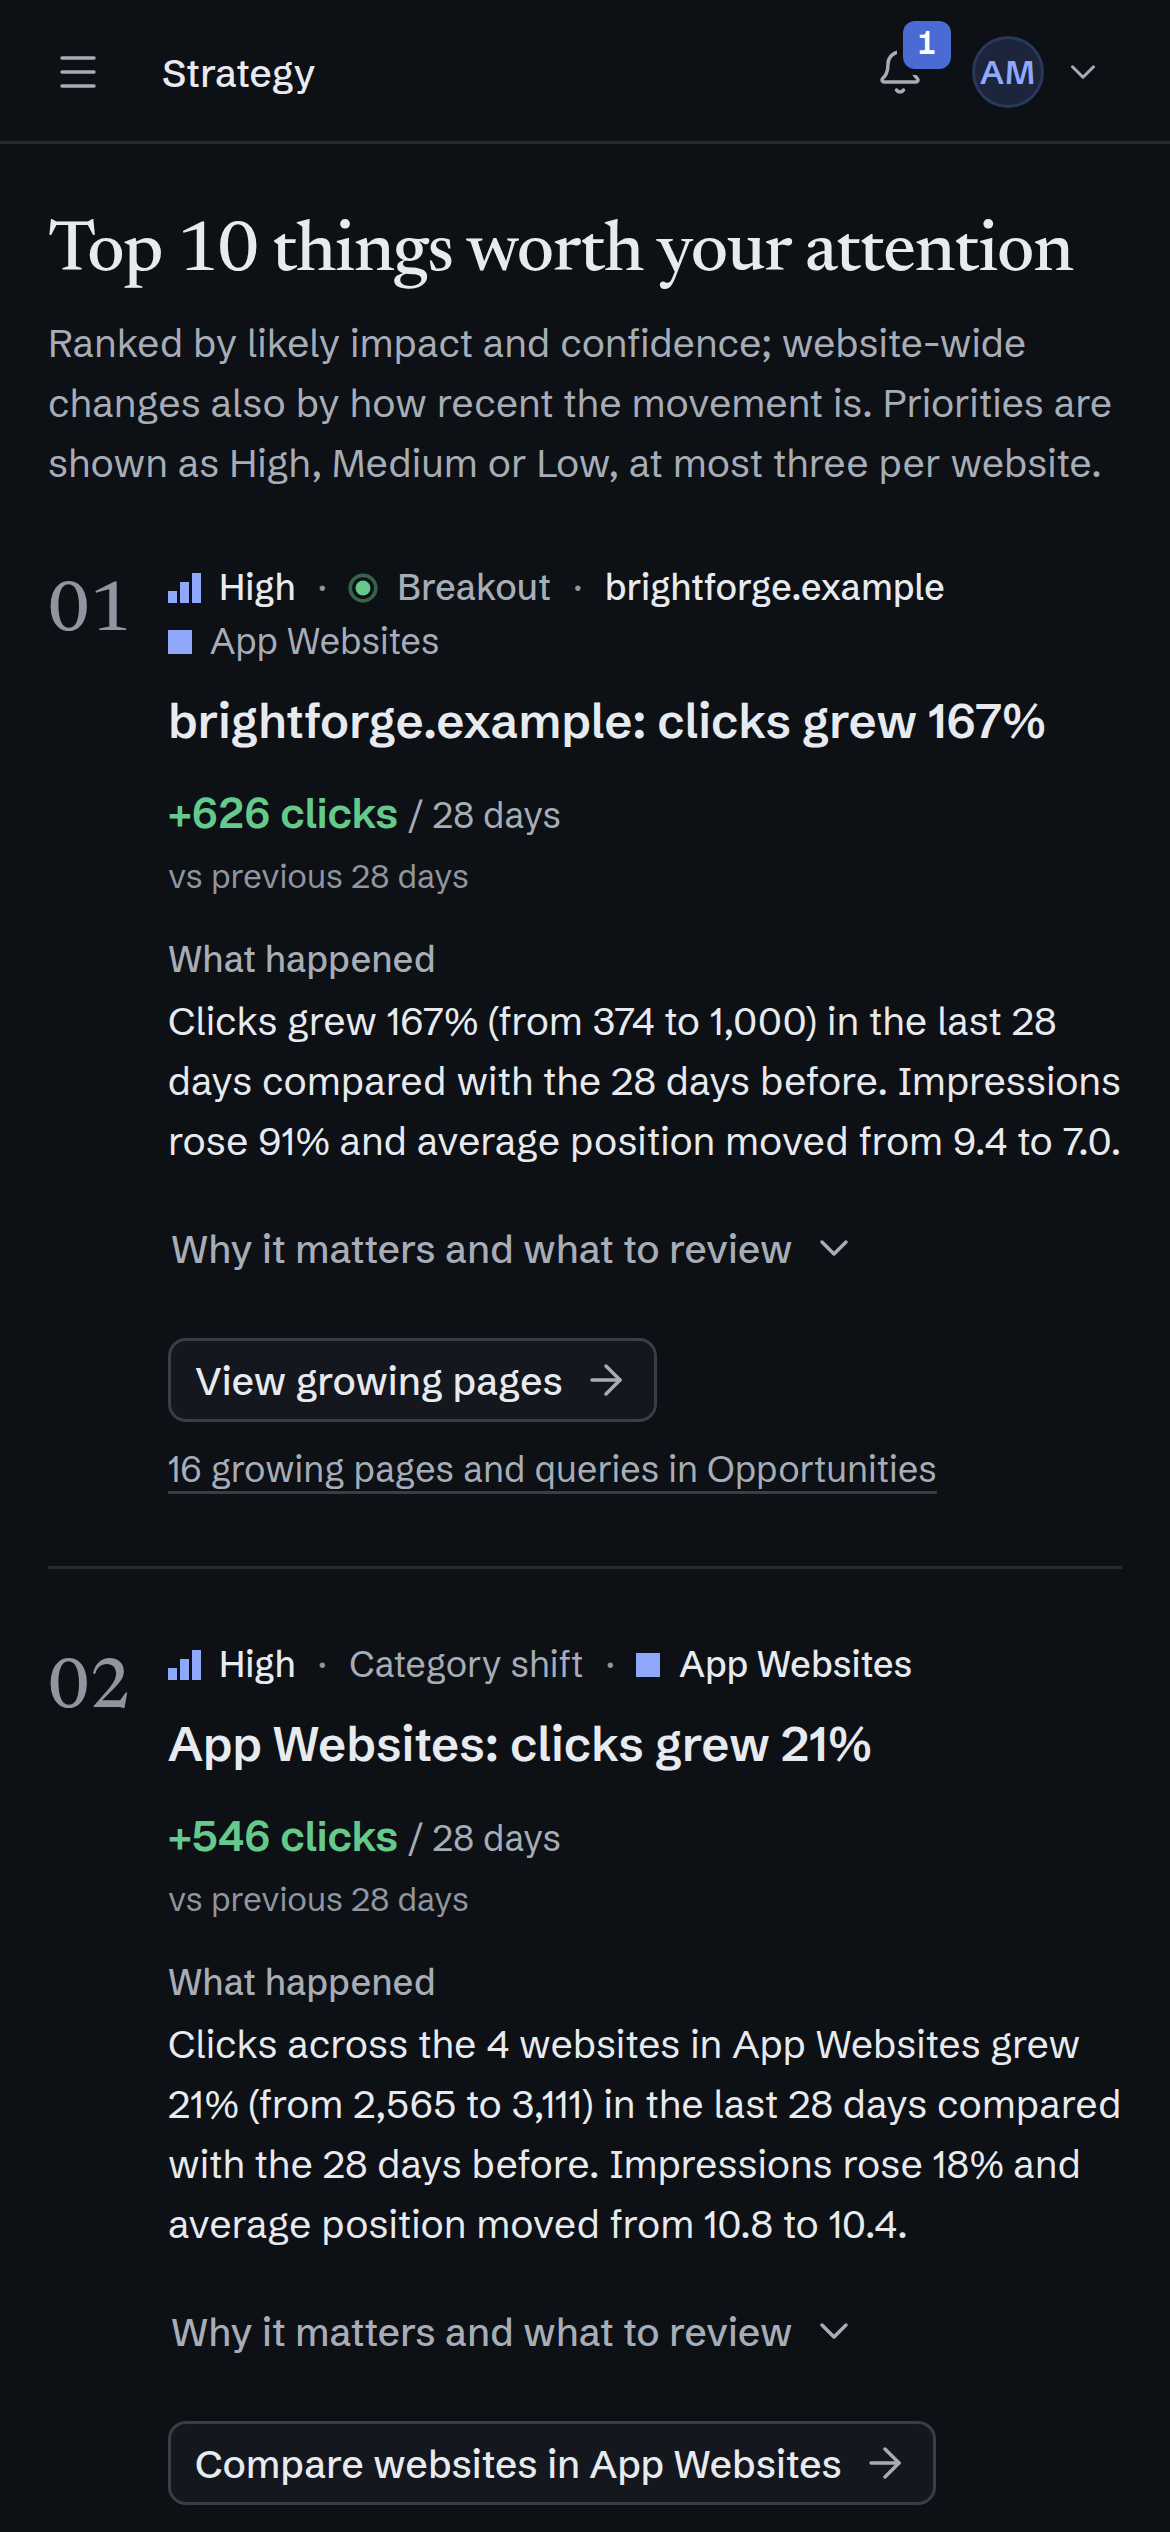
The first two of Strategy’s “Top 10 things worth your attention” on a phone: 01, “brightforge.example: clicks grew 167%” (+626 clicks in 28 days), and 02, “App Websites: clicks grew 21%” (+546 clicks), each with what happened and, a tap away, why it matters and what to review.
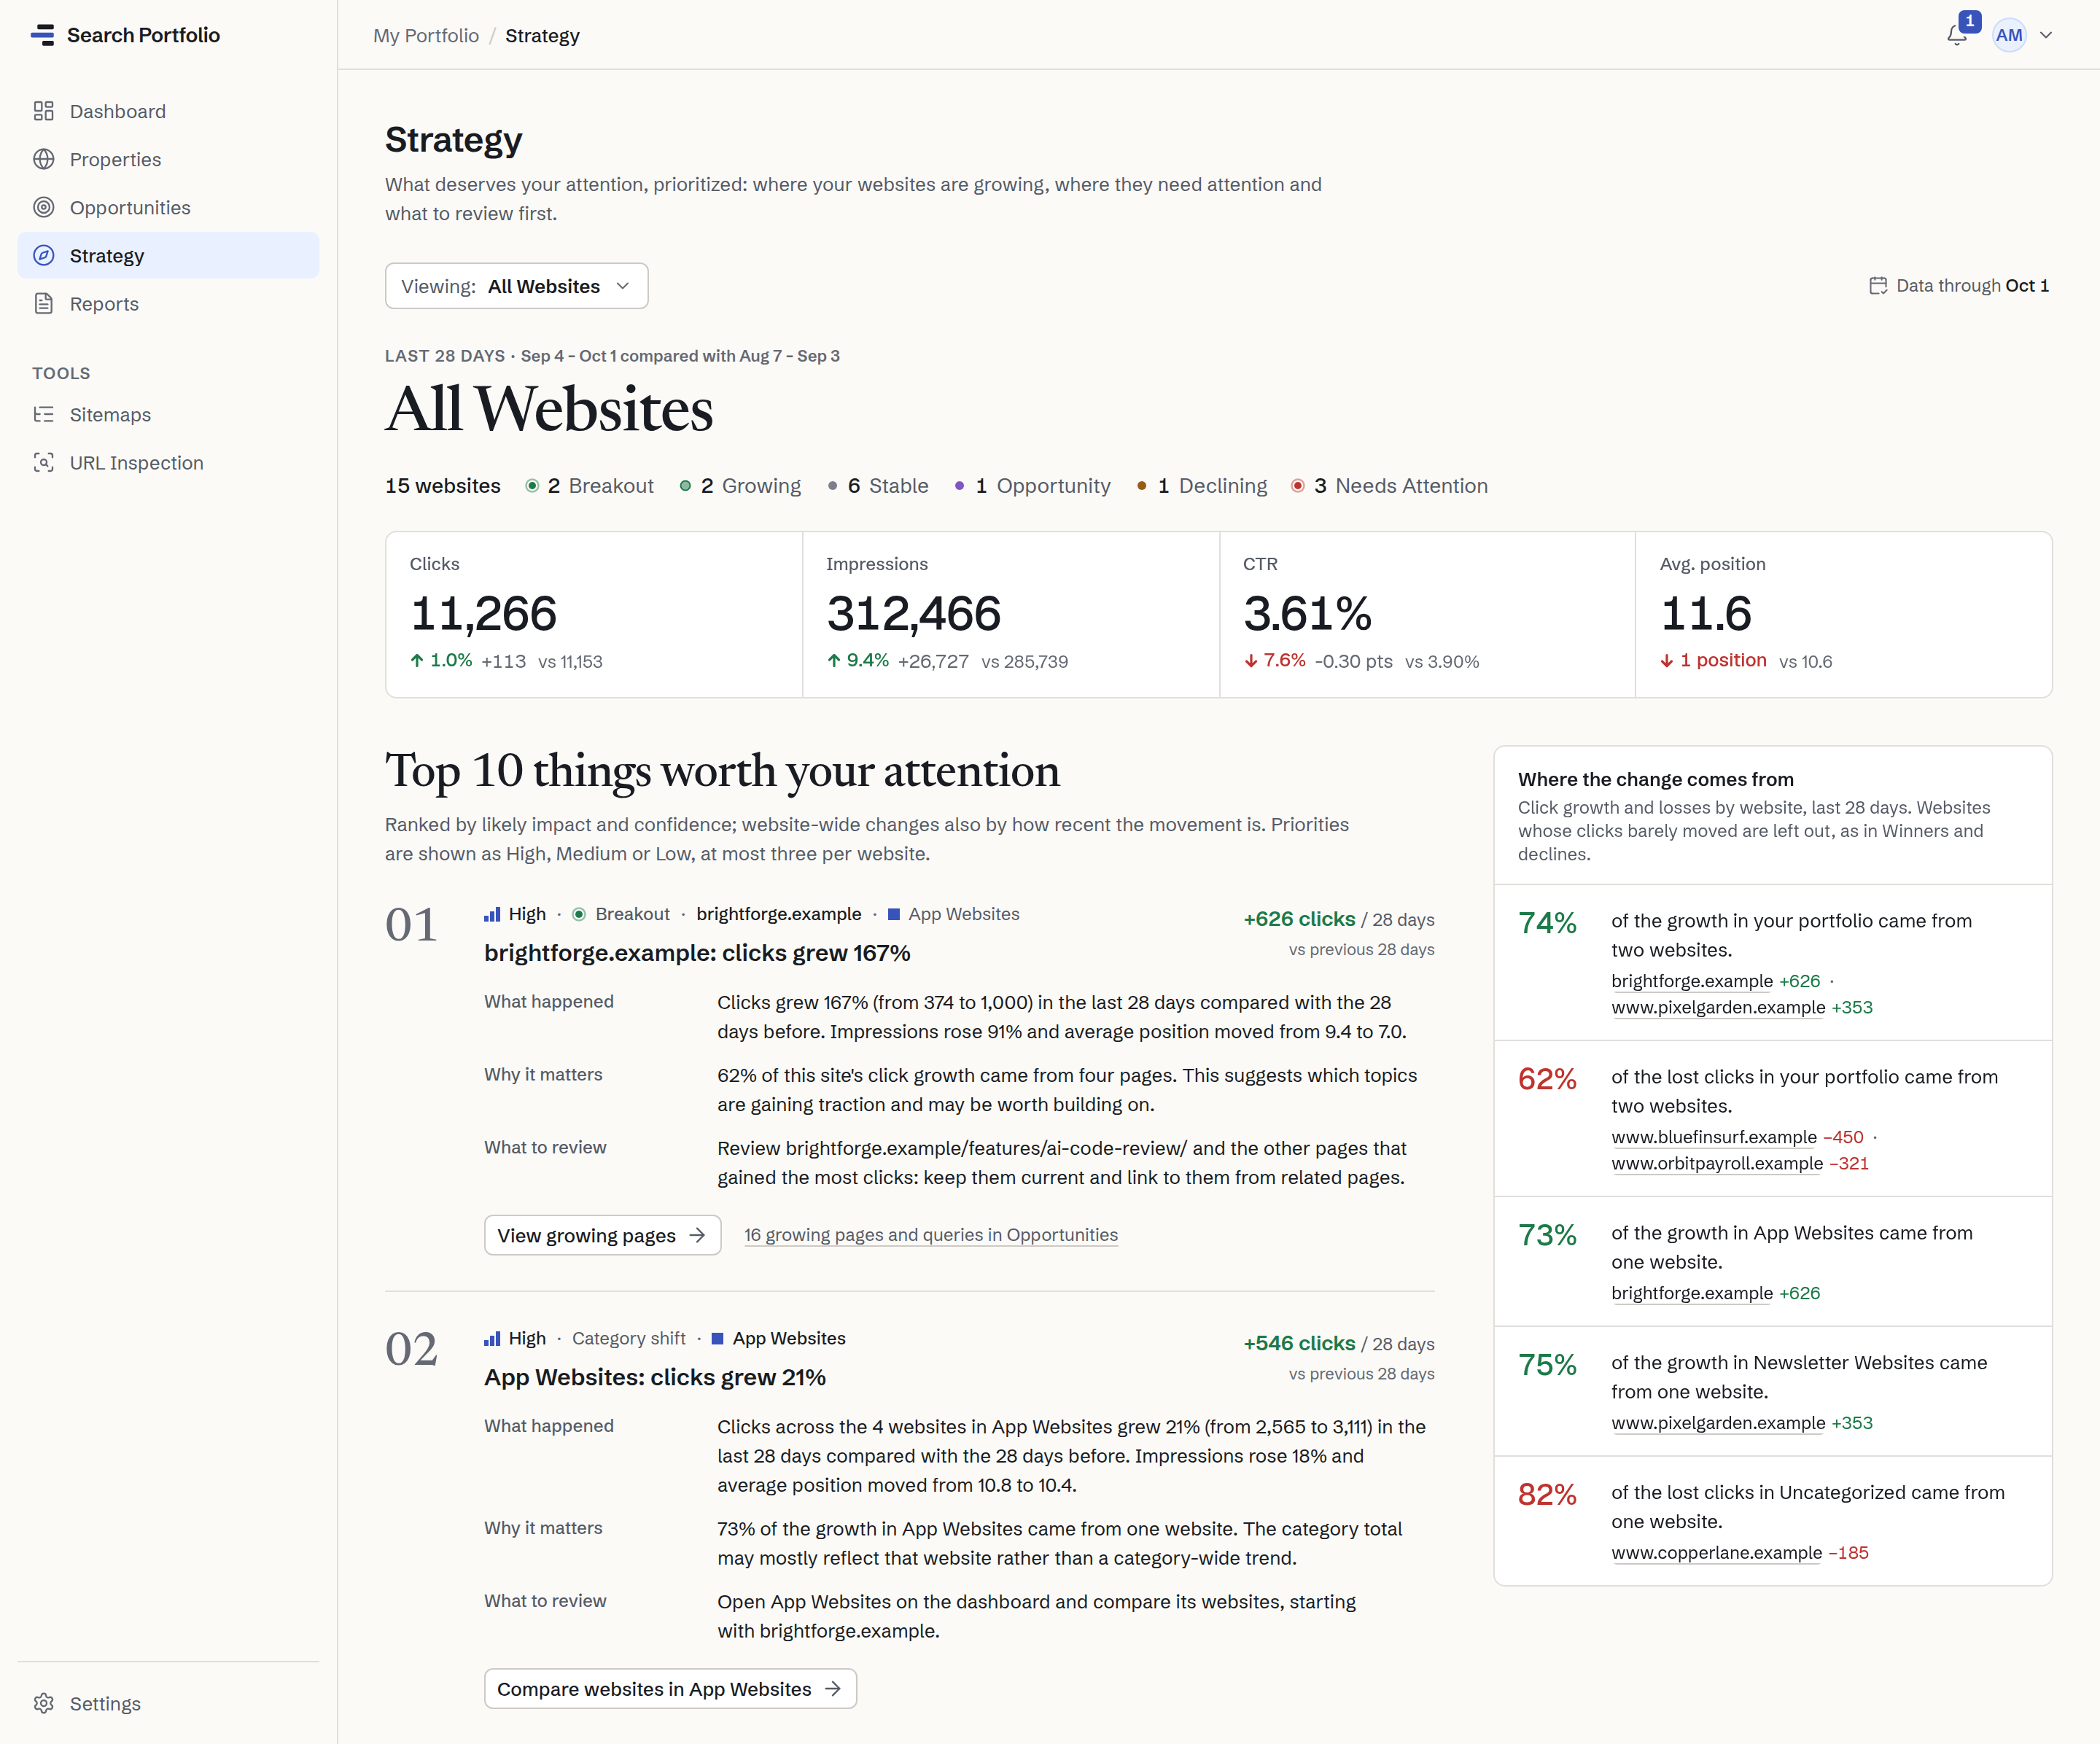
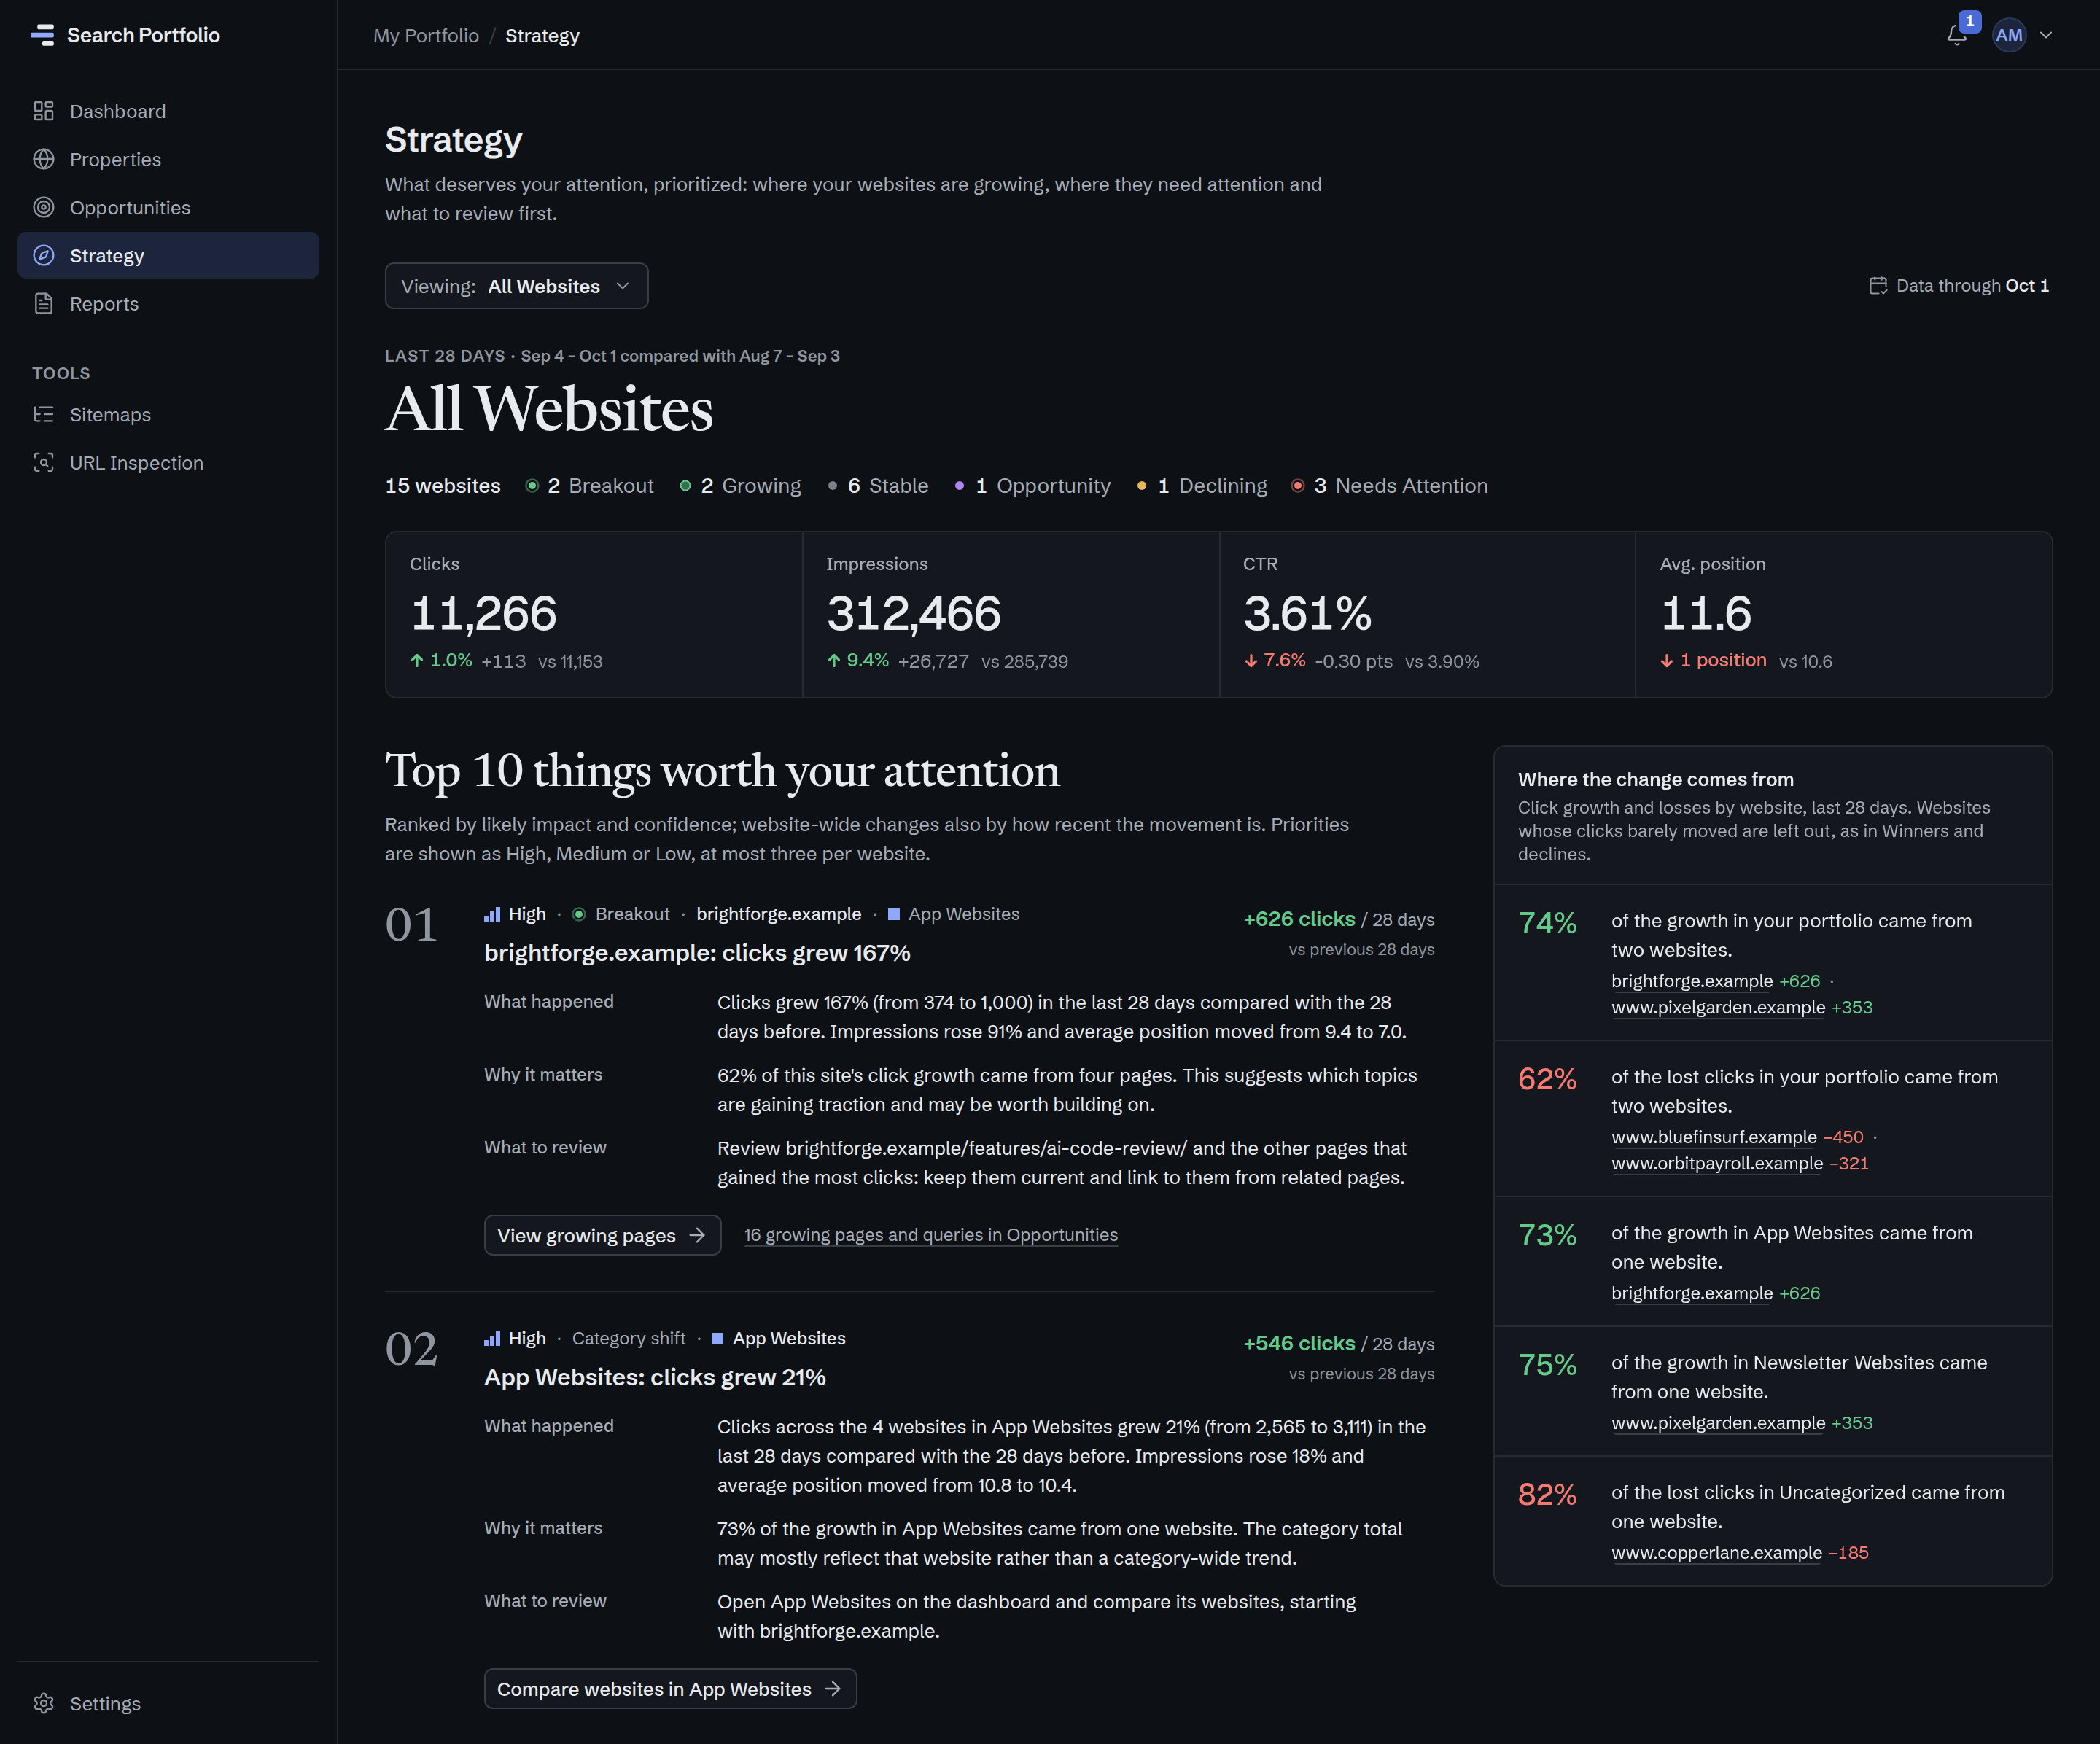
The first two of Strategy’s “Top 10 things worth your attention”, ranked by likely impact and confidence: 01, a High-priority breakout, “brightforge.example: clicks grew 167%” (+626 clicks in 28 days), and 02, a High-priority category shift, “App Websites: clicks grew 21%” (+546 clicks). Each states what happened, why it matters and what to review, with a link to the evidence.
Strategy · Top 10 things worth your attentionProduct screenshot · example data

Weekly Intelligence

Receive a concise portfolio summary automatically.

Weekly email reports are included from Solo ($9 a month).

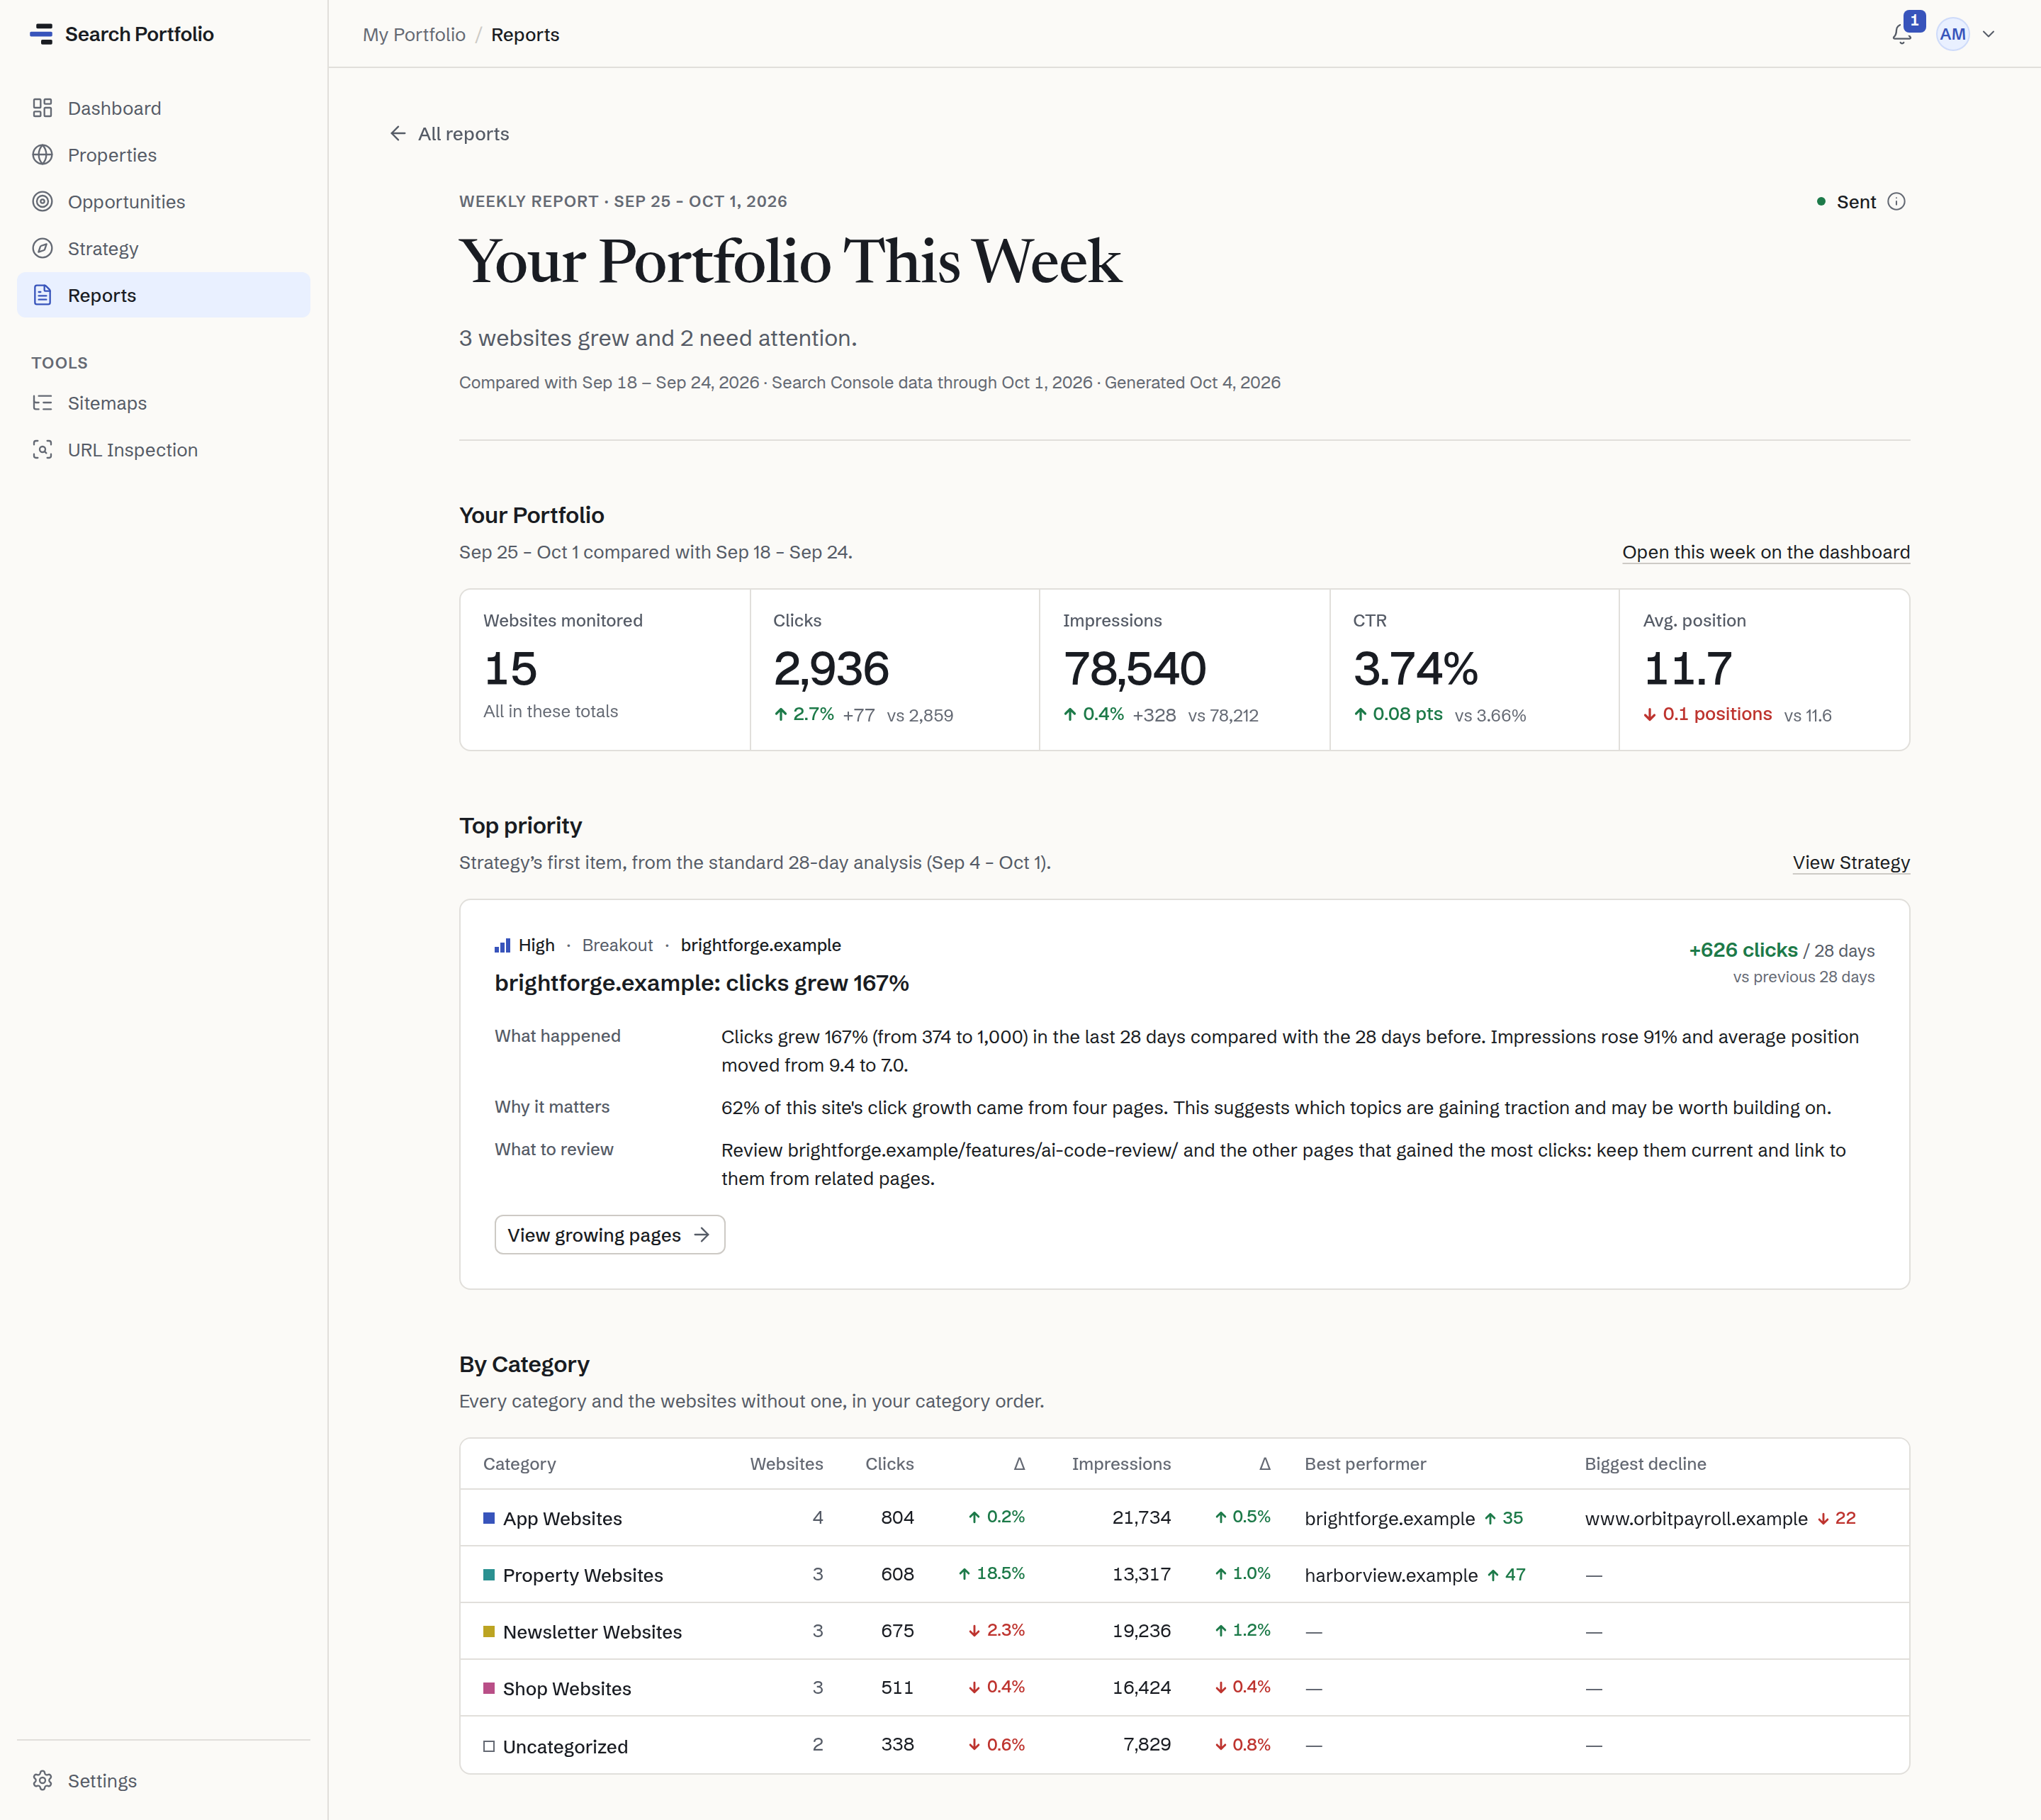
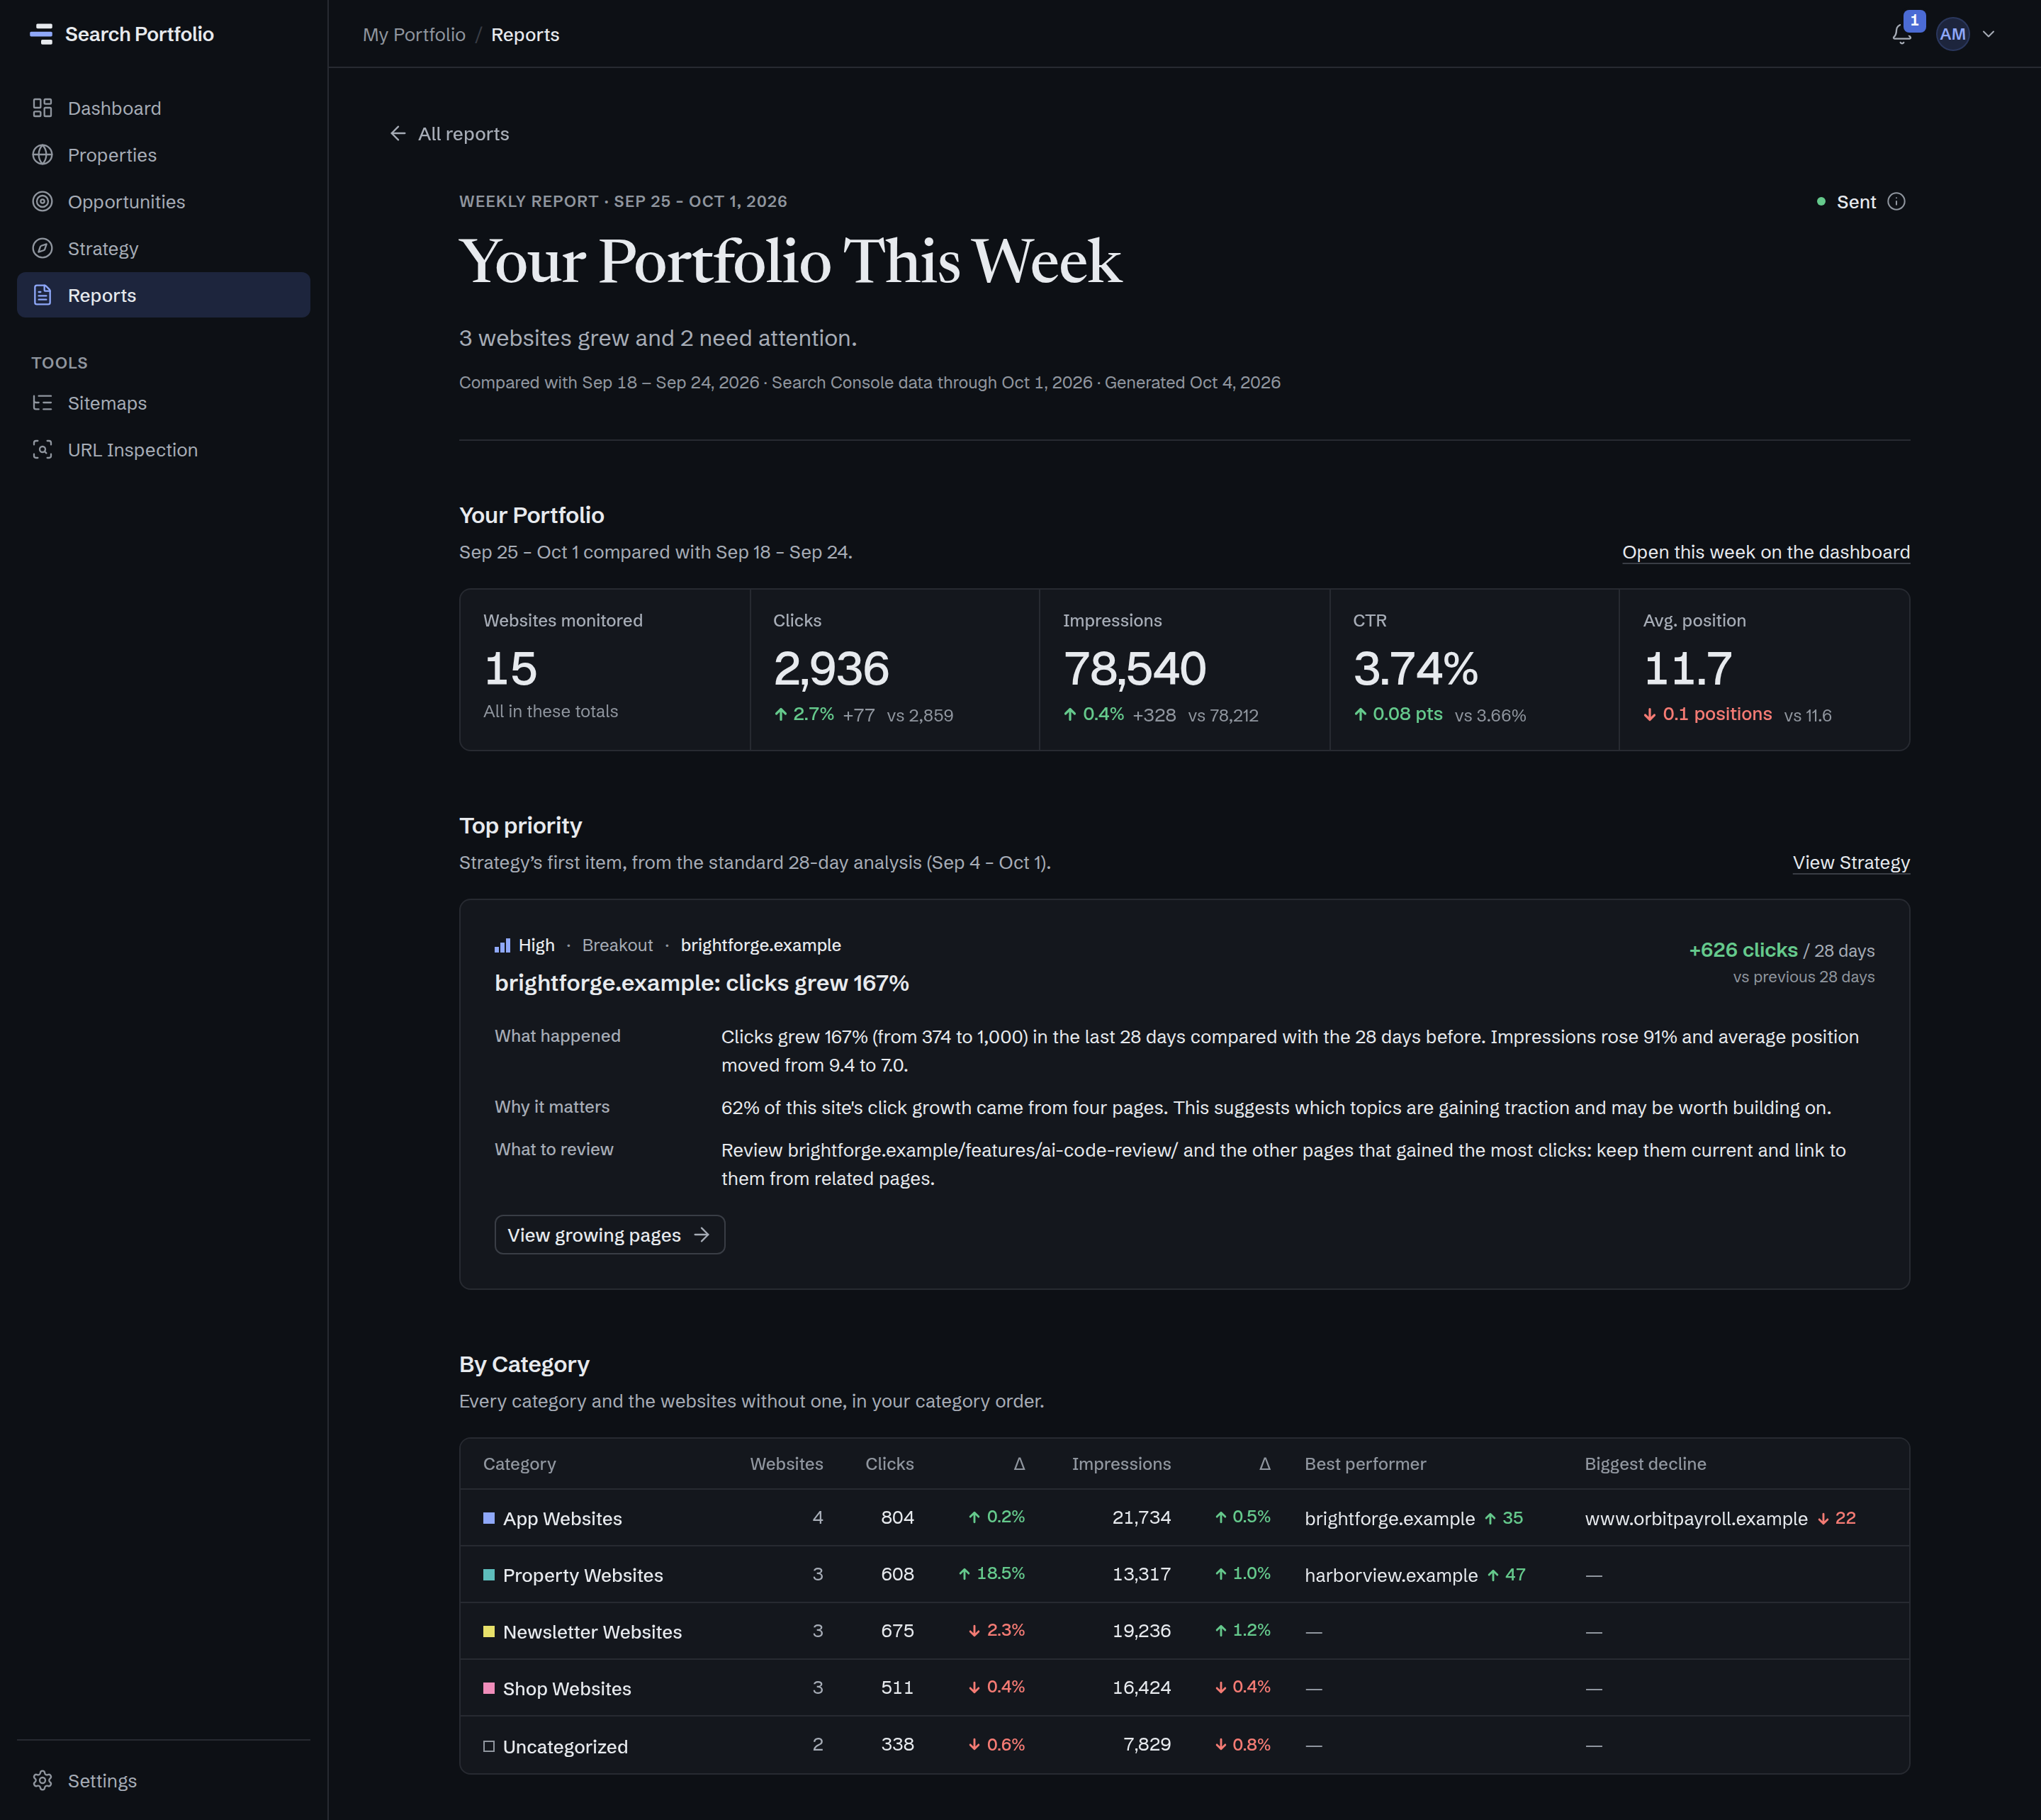
Your Portfolio This Week.
The week against the week before, then Strategy’s top priority.
Every category.
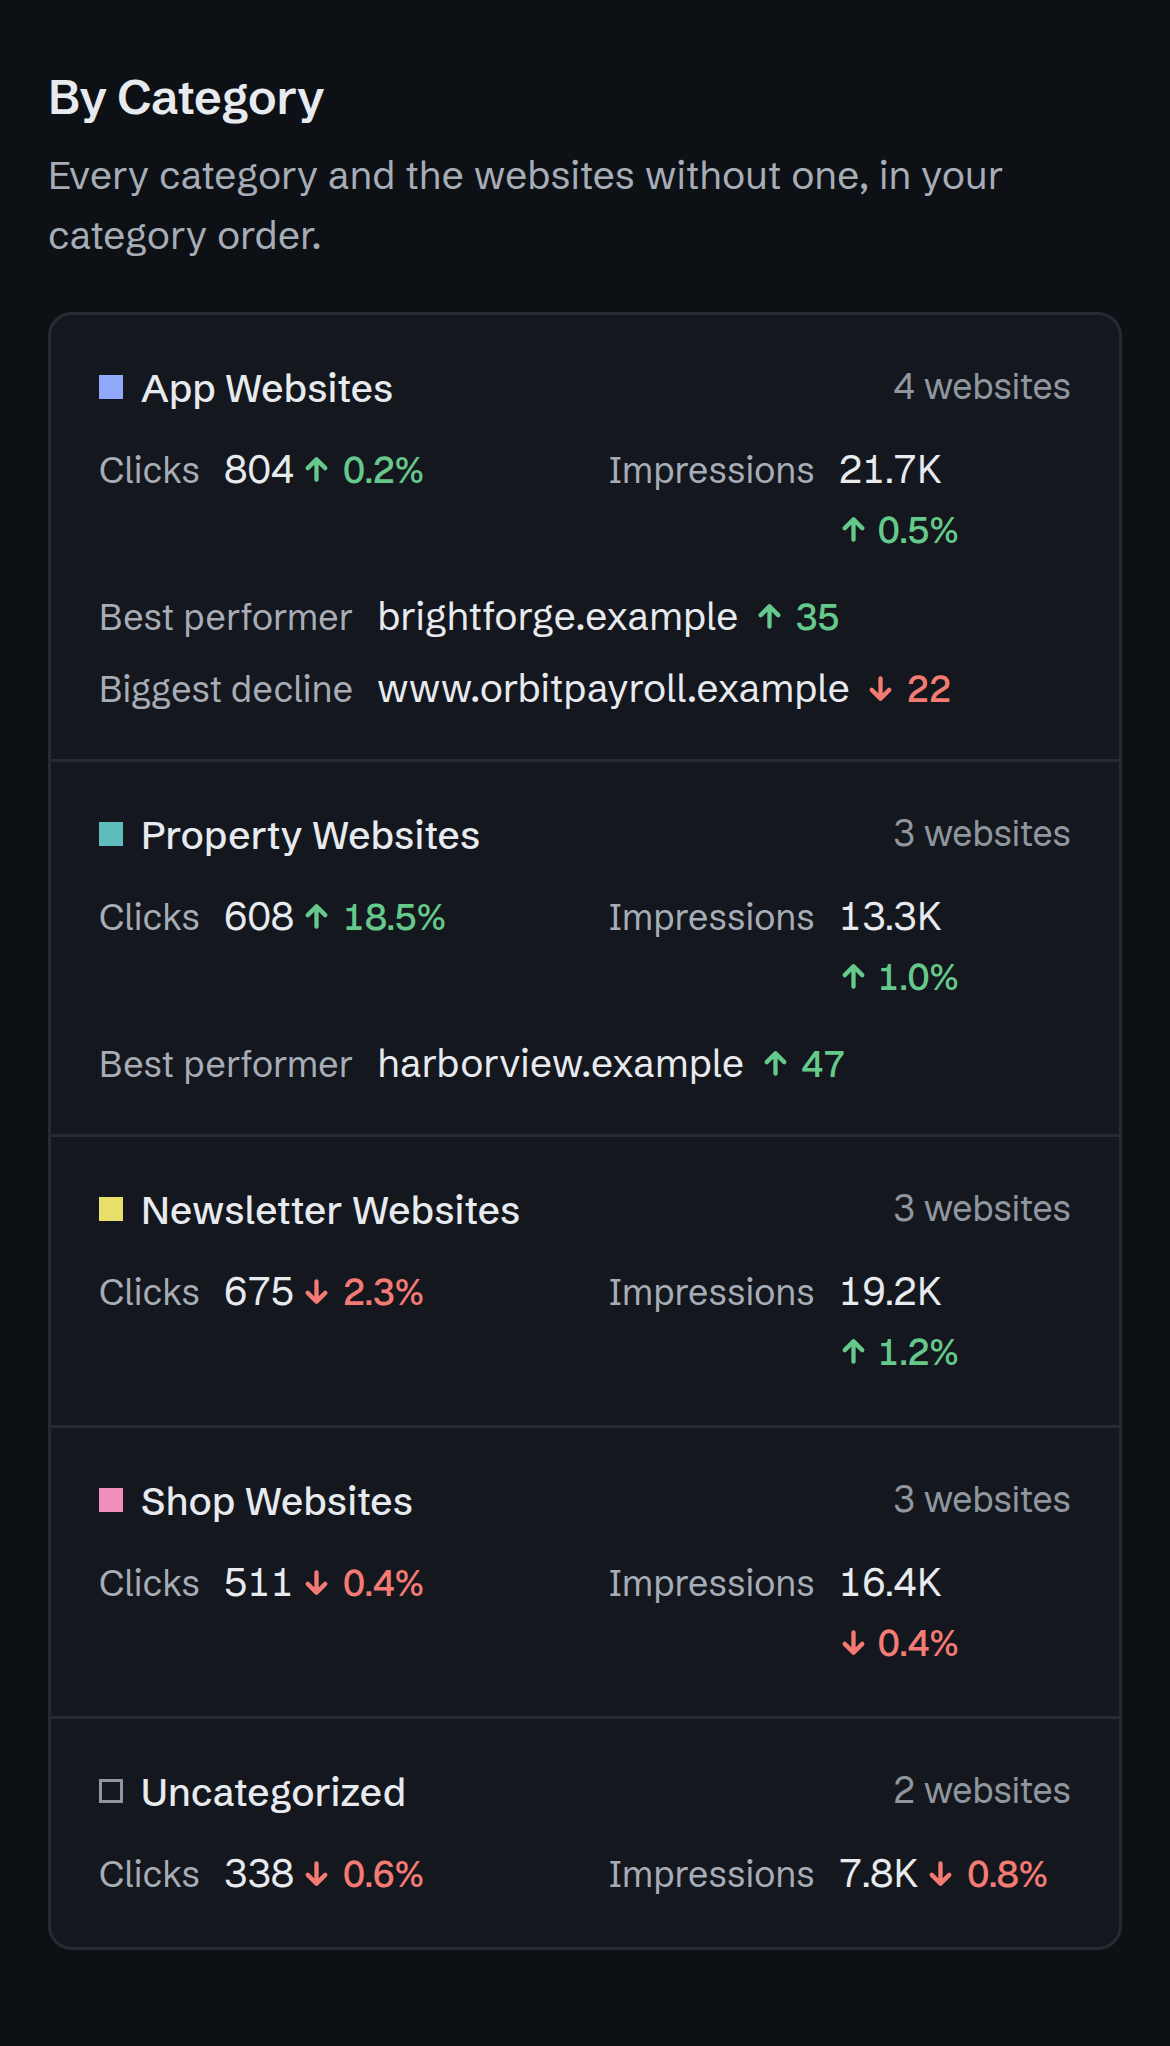
Each with its clicks, impressions, best performer and biggest decline.
On your schedule.
Choose the day it arrives, or turn it off. Every report stays in the app.
Finalized data.
Each report says which days it covers and how fresh the data is.
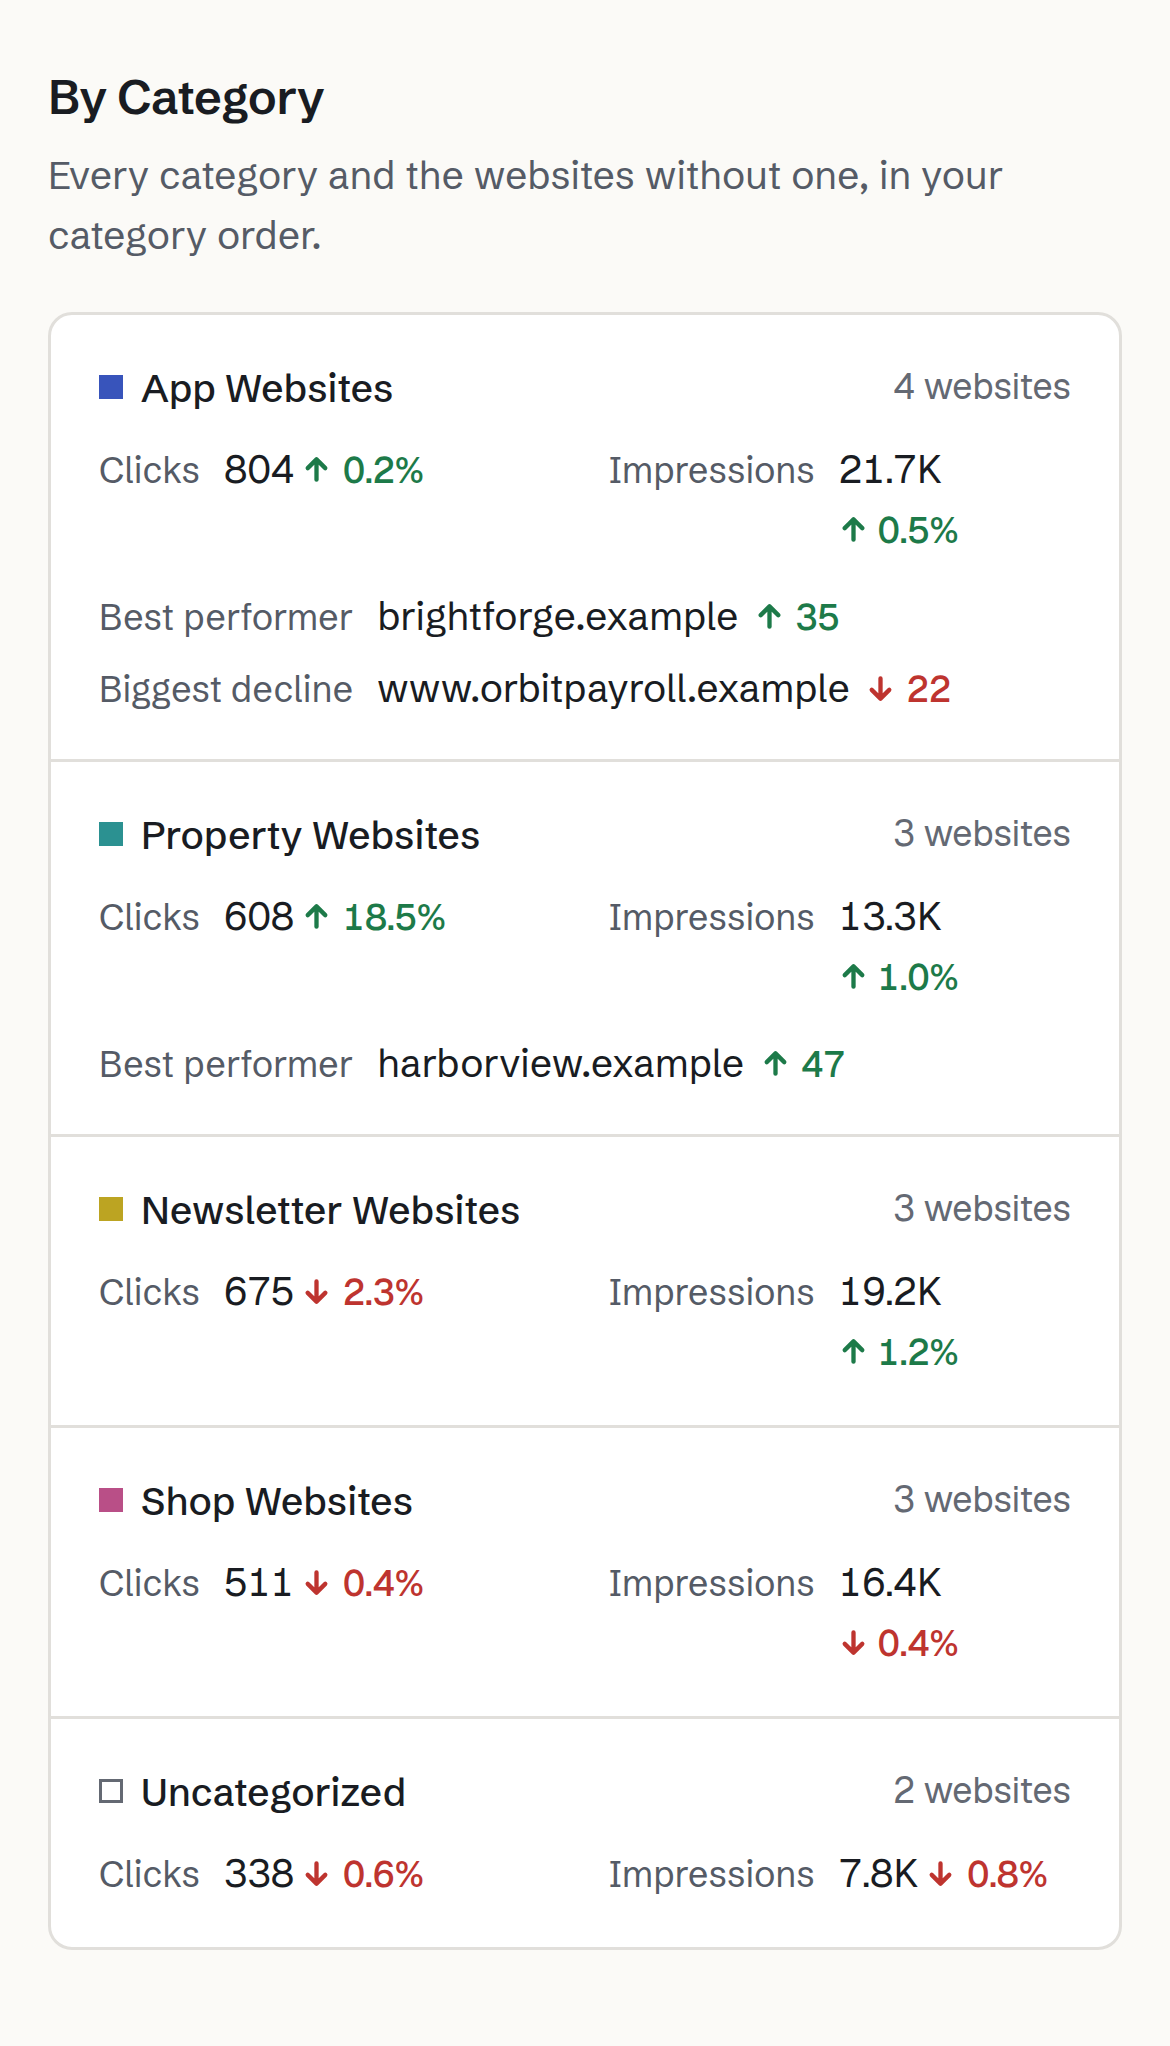
The weekly report's "By Category" section on a phone: App Websites, Property Websites, Newsletter Websites, Shop Websites and Uncategorized, each with its clicks and impressions for the week against the week before, its best performer and its biggest decline.
Two sections of the weekly report “Your Portfolio This Week”: the top priority from Strategy, “brightforge.example: clicks grew 167%”, with what happened, why it matters and what to review; then By Category, every category and the websites without one, with the week’s clicks and impressions against the week before, its best performer and its biggest decline.
Weekly report “Your Portfolio This Week” · top priority and every categoryProduct screenshot · example data

Trust

Your Search Console data, handled carefully.

We only read what the product needs, and you stay in control of it. Read the privacy policy

Read-only access
Search Portfolio requests Google’s read-only Search Console scope. It cannot change your properties, users, settings or sitemaps.
Encrypted tokens
Google tokens are encrypted with AES-256-GCM, used only on our servers and never sent to your browser.
Finalized data only
Analysis uses the days Google has finalized, so periods are compared fairly, and every view says how fresh it is: “Data through Oct 1”.
Disconnect or delete anytime
Disconnect a Google account, delete imported data or delete your account yourself in Settings, or remove access in your Google Account. How deletion works
Independent product
Search Portfolio works with your Google Search Console data. It is not affiliated with or endorsed by Google.

FAQ

Questions, answered plainly.

Something else? Contact support.

What data does Search Portfolio access?

Google Search Console data, and only after you connect a Google account and approve read-only access on Google’s consent screen: the properties your account can access (and your permission level), performance data (clicks, impressions, click-through rate and average position by date, query, page, country, device and search appearance), the status of submitted sitemaps, and URL Inspection results for URLs you choose to inspect. Each connection also shares that Google account’s email address, so you can tell your connections apart.

No other Google service is accessed. Optional “Sign in with Google” shares only your name, email address and profile picture to sign you in; it does not give access to Search Console. The privacy policy lists exactly what is stored and for how long.

Can Search Portfolio change anything in Search Console?

No. It requests Google’s read-only Search Console scope, so it cannot add or remove properties or users, submit or delete sitemaps, or change any setting. Google tokens are encrypted with AES-256-GCM and never reach your browser.

Can I connect more than one Google account?

Yes. Many people keep websites in different Google accounts. Connect each one and every property you select appears in a single portfolio; a property that two of your accounts can access appears once. Free includes 1 Google account; Solo, Portfolio and Agency include up to 5, 15 and 50.

How do categories work?

Put each monitored property in a category you name (App Websites, Client Sites, Newsletters) or leave it Uncategorized. The Viewing switcher then turns the dashboard, Opportunities and Strategy into a view of just that category, and the weekly report lists every category with its best performer and biggest decline. Categories are included on every plan, including Free.

Why is my data two or three days behind?

Google finalizes Search Console performance data with a delay, typically two to three days. Search Portfolio analyzes finalized days only, so a period is never compared with a half-counted one, and it always shows how fresh the numbers are, for example “Data through Oct 1”. It never presents the data as live.

How are opportunities detected without AI guesswork?

With fixed rules applied to your own Search Console data, not a language model. A query is in striking distance when its average position is between 4 and 15 with at least 100 impressions in 28 days. A click-through-rate opportunity earns less than 60% of the click-through rate expected at its position, judged from the site’s own results, from your portfolio’s when a site has too little data, or from a conservative default when neither has enough. A decline needs both a 20% drop and at least 20 lost clicks, so tiny numbers never set off alarms.

Each opportunity shows the numbers behind it and a confidence level, and explanations stay hedged: a pattern “appears” or “suggests”; it is never presented as a proven cause. Your data is not used to train AI models.

How much does it cost, and what are the plan limits?

Free covers 3 monitored properties, 1 Google account, the dashboard, categories and your top 5 opportunities. Solo ($9 a month) monitors up to 10 properties across 5 Google accounts and adds every opportunity, Strategy and weekly email reports. Portfolio ($19) raises the limits to 50 properties and 15 accounts and adds alerts; Agency ($49) allows 200 properties and 50 accounts.

Paid plans open soon; until then every account uses Free. Properties beyond your limit stay listed, so you always see what is available. Compare plans

How do I disconnect Google or delete my data?

Disconnect a Google account in Settings → Google Connections, or remove Search Portfolio’s access in your Google Account at any time. In Settings → Data & Privacy you can delete all imported Search Console data (which also disconnects every Google account) or your whole account (if your workspace has a paid plan that still renews, cancel it in Manage billing first); deletion from our live database is immediate. How deletion works

Bring every website into one view.

Start free with up to 3 properties, the dashboard, categories and your top 5 opportunities. No credit card required.